Test Suite and Top-Level Results
Contents
We won’t keep you in suspense. When we look at the “big picture” of all the top-level test results, Parallels is, once again, the clear winner. Let’s look at this in three groups of tests.
If you look at all the tests, including the 3DMark06 detailed tests, Parallels won over 68% by 5% or more, 56.9% of the tests by 10% or more, and 31.7% by 25% or more. VMware Fusion won 7% of these tests by 5% or more, 3.7% by 10% or more, and 0.2% by 25% or more. In 24% of the tests, the two products were within 5% of each other (i.e., they tied).
In our general and top level tests, which gives a good variety of challenges including top level 3D Graphics tests (but drops the detailed graphics tests), Parallels won over 68% by 5% or more, 55% of the tests by 10% or more, 27% by 25% or more. VMware won 7% of these tests by 5% or more, 4.5% by 10% or more, and 0.3% by 25% or more. Just over 24% were a tie.
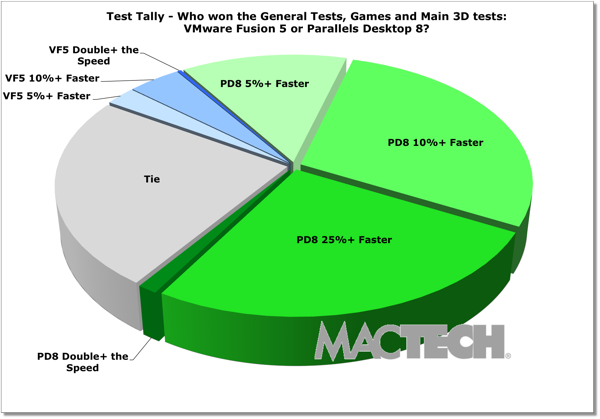 Figure 1: Test Tally: General Virtualization Tests
If you focus exclusively on 3D graphics, as measured by 3DMark06, Parallels won by an even larger margin. Specifically, Parallels won 62.6% of the tests by 10% or more, and was also a bit faster (at least 5%) on an additional 8.9% more of the tests, and tied on the rest. VMware Fusion 5.0.2 was faster than Parallels in 4.4% of the 3D graphics tests we ran.
3DMark06 has three main aggregate scores. The most important of which is the “3DMark Score.” In addition, SM2.0 Score measures 3D Shader Model 2.0 performance, and the HDR/SM3.0 Score measures the 3D Shader Model 3.0 & HDR performance.
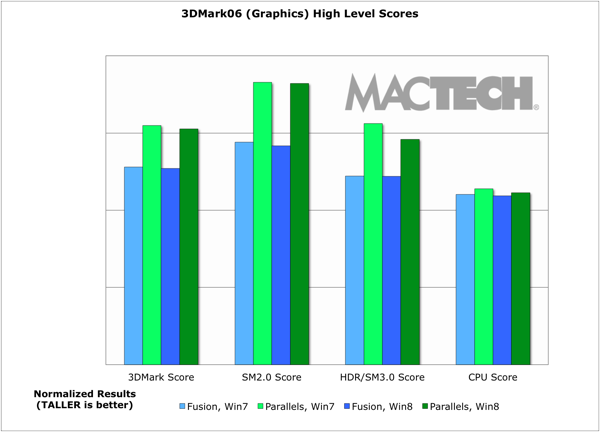 Figure 2: Test Tally: 3D Graphics Tests
There are a handful of places where VMware Fusion consistently was faster than Parallels Desktop. For example, successive launches of Microsoft Word were faster (usually by about a quarter of a second). Also, when running OS X as a guest, VMware was consistently faster on shut down of the guest.
Parallels Desktop has power management features that stretch your battery life. On the MacBook Pro, we saw about 40% more battery time on an idling virtual machine with Internet Explorer open (which results in about two hours of additional use) than we did on VMware Fusion in the same test in Windows 7. Parallels ran Windows 8 about 40 minutes longer as well before running out of juice.
One of the best ways to visualize the huge amount of data points is through MacTech‘s well-known “Colored Cell Worksheet Overview.” In these worksheets, a cell represents the best result for each test for each version of Windows for each virtualization product. These are then colored according to which product was faster.
Green cell coloring means Parallels Desktop was faster than VMware Fusion. A blue cell coloring indicates VMware Fusion was faster than Parallels Desktop. Scores that were within 5% of one another are considered a tie. Coloring darkness has four thresholds: >5%, >10%, >25% and double the speed or more. (Note: Not all tests were run on all configurations, hence the empty cells.)
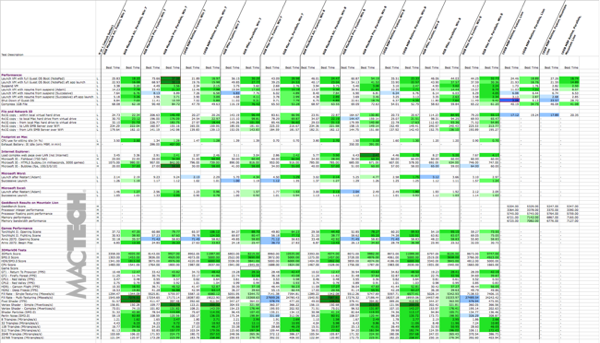 Figure 3: MacTech’s Colored Cell Worksheet Overview
Obviously, when you look at the amount of green on the worksheet, you can see that Parallels was faster in the vast majority of tests that we ran. That said, VMware has made improvements in overall speed since the last time we looked at these two products.
The Test Suite and Results
In the sections below, we’ll walk you through what we tested, and the results for each. These tests are designed to arm you with the information so you can make the best decision for your type of use.
For each set of results, you can see the analysis for each model of computer running Windows 7 and 8. If you want to see more detail on the tests or on an individual Mac model, you may want to review the spreadsheet for those details.
As you look through the charts below, pay attention to whether the better result is represented by taller or shorter bars. For vertical bars, taller is better. For horizontal bars, shorter is better. See the lower left corner of each chart as a reminder.
For the launch tests (launching the VM, Booting Windows, and Suspend/Resume), we had the option of an "Adam" test and a "Successive" test. Adam tests are when the computer has been completely restarted (hence avoiding both host and guest OS caching). Successive tests are repeated tests without restarting the machine in between tests, and can benefit from caching. Both can mimic real use situations depending on a user’s work habits.
The tests used were selected specifically to give a real-world view of what VMware Fusion and Parallels Desktop are like for many users. We didn’t focus on the tests that were so short in time frame (e.g., fast) that we could not create statistically significant results, or that had unperceivable differences.
For some of the analysis, we "normalized" results by dividing the result by the fastest result for that test across all the machine configurations. We did this specifically so that we could make comparisons across different groups, and to be able to give you overview results combining a series of types of tests, and computer models.
Instead of a plain "average" or "mean", overall conclusions are done using a "geomean", which is a specific type of average that focuses on the central results and minimizes outliers. Geomean is the same averaging methodology used by SPEC tests, PCMark, Unixbench, and others, and it helps prevent against minor result skewing. (If you are interested in how it differs from a mean, instead of adding the set of numbers and then dividing the sum by the count of numbers in the set, n, the numbers are multiplied and then the nth root of the resulting product is taken).
For those interested in the benchmarking methodologies, see the more detailed testing information in Appendix A. For the detailed results of the tests used for the analysis, see Appendix B. Both appendices are available on the MacTech web site.