MacTech Labs: Virtualization Benchmarks
Head-to-Head: How do VMware Fusion 4 and Parallels Desktop 7 for Mac compare?
By Neil Ticktin, Editor-in-Chief/Publisher
Why Virtualization?
In 2005, Apple announced the switch of the Mac platform from PowerPC to Intel processors (the first Intel-based models were available in early 2006). This introduced some interesting opportunities for the Mac, including the ability to run operating systems other than Mac OS X on a Mac. This includes not only your everyday Windows 7 or XP, but also other Windows OSes, including 64-bit versions and a wide variety of Linux and other OSes.
You may already understand your options for running Windows on a Mac, but in case you don’t, your first choice is to decide between Apple’s Boot Camp, and a virtualization product like VMware Fusion or Parallels Desktop for Mac. With Apple’s Boot Camp, you can run Windows natively, but you have to reboot every time you want to switch between Mac OS and Windows. In addition, you can only use one OS at a time. Despite a speed advantage for some things, that’s not particularly convenient. For that reason, MacTech recommends a virtualization product for most users.
In addition, virtualization gives “switchers” (those switching from Windows to Mac) more comfort because they can use their old applications and more easily get to their old data. It gives all Mac users the ability to use some critical piece of software not available on the Mac. For example, your job may require you to run Internet Explorer, the Windows version of Outlook, or some other software that your corporate systems support. Or, you may simply want to play a Windows game not available on the Mac.
With virtualization, like you’ll see in Parallels Desktop for Mac or in VMware Fusion, you can run Windows alongside the Mac OS, getting the best of both worlds. For many, this may mean running Windows in a “window” on your Mac. Both VMware Fusion and Parallels Desktop also have the ability to run Windows applications even more transparently or full screen, but we’ll leave that for another discussion.
Your final option is to use Parallels Desktop for Mac or VMware Fusion to access/use your Boot Camp volume rather than a virtual hard disk. This gives you the option of sometimes booting Windows natively, and other times, using the volume for virtualization. As the performance of doing this has improved so much, this has become a real option for users.
The Big Question
So which virtualization product do you go with? Which solution is faster? Should you run Windows XP or 7? 32-bit or 64-bit? One virtual processor or more? Can you run Lion in a virtual machine? In short, there are different answers for different people; it all depends on your needs. More and more, virtualization can accommodate whatever your needs might be.
To tackle this problem, MacTech has once again undertaken a huge benchmarking project. We often wait for a patch or two after major upgrades to give time for major new versions to shake out. This is similar to the virtualization benchmarking projects that MacTech undertook in past. In both cases, as with other MacTech benchmarks, we tested performance of the types of things that everyday users typically do. In this case, it was not just testing the raw performance of the Windows OS, but also commonly used Windows applications. Like last time, based on reader feedback, we paid attention to 3D graphics and gaming.
The goal was to see how VMware Fusion and Parallels Desktop performed, under Windows 7 (XP runs too, but it’s time to move on). Furthermore, we wanted to see some of the differences with different Mac models with different graphics and processor types.
To be clear, this article is not a product review; it’s a benchmarking analysis. The article’s purpose is to assess performance (including issues we found if something didn’t work as expected), and not product features, user interface, etc… You should use your assessment of features, user interface, and support in conjunction with the below benchmarking results to make your product choice.
Before you ask why other solutions and products were not included, let’s answer that. This benchmark project is already huge with thousands of collected data points crossing two guest OSes (Windows 7 and Lion), five models of computers with mechanical hard drives and SSDs, and over 50 tests each run 3-5 times for most of the environments. There were a couple thousand tests to be completed, many with a stopwatch. That’s all before a single word of this article is written!
To add even one product would increase this huge test matrix by 50%. As a result, we focused on the two leading commercial virtualization products that come with support. These two products also have free trial versions that you can compare against other solutions so you can try them for yourself and compare them alongside any other solution you want at any time including before you buy.
One thing to note, however, is that open source and other free products may not be for everyone, especially non-technical users. For many, these offerings can be difficult to understand and install, and they do not have technical or product support behind them. Obviously, users can reach out in forums and the community, but if you don’t understand something, you won’t be able to pick up the phone and call support the way you can with a commercial product. If that works for you, great. If not, as is the case for most users, then a commercial product is likely your solution.
The Test Bench
When we were choosing computer models, we chose the current model of Macs that give a good representation of what most people may have. Certainly, the faster models of these computers will perform even better.
We chose five Mac models to compare alongside each other: the “White” MacBook, MacBook Air, MacBook Pro, iMac, and Mac Pro. Given the RAM requirements of Windows 7, the minimum configuration tested (including on the MacBook) was 4 GB.
- 4 GB MacBook, Intel Core 2 Duo processor (“White MacBook”)
Specifically: MacBook 2.4 GHz 2 GB/250 GB White Unibody (Mid-2010) upgraded to 4 GB - 4 GB MacBook Air 13-inch, Core i5 processor
Specifically: 1.7 GHz Core i5 4 GB/128 GB, Intel HD Graphics 3000 - 4 GB MacBook Pro, Intel i7 processor (“Unibody MacBook Pro”)
Specifically: MacBook Pro 15.4 in. 2.0 GHz i7 4 GB/500 GB 5400-rpm
Intel HD Graphics 3000 and AMD Radeon HD 6490M with 256 MB GDDR5 - 4 GB iMac 27″, Intel i5 processor
Specifically: iMac 27 in. 2.7 GHz Intel Core i5 4 GB/1 TB 7200-rpm
AMD Radeon HD 6770M with 512 MB - 6 GB Mac Pro, Quad-Core Intel Xeon processors
Specifically: 6 GB/1 TB 7200-rpm / ATI Radeon HD 5770 with 1 GB GDDR5
Two 2.4 GHz Quad-Core Intel Xeon “Westmere” processors
Memory for virtual machines can be configured with a wide array of settings. As a general rule, both VMware Fusion’s and Parallels Desktop’s default memory for each configuration (of physical RAM and “guest” OS) were the same. Windows 7 virtual machines ran with 1 GB of virtual machine RAM. Lion ran with 2 GB of virtual machine RAM.
Similarly, for disk allocation we set up all of the virtual machines the same way. We used 40 GB expanding disks in a single file (e.g., not 2 GB chunks), but the disks were pre-expanded so that expanding actions wouldn’t affect results. The disk location of the virtual hard drive was in a similar physical location between computers, as that can make a significant difference in disk performance.
The tests compared VMware Fusion 4.0.2 with Parallels Desktop for Mac 7.0.14924.699487, running Mac OS X 10.7.1 with all updates as of the end of September. All Windows updates as of the end of September were installed for Windows 7.
Test Types
There are a variety of often referred to, and utilized benchmarking suites in the computer industry including SPEC tests, PCMark, WorldBench, Performance Test, Unixbench and others. Each of these tests uses a series of tests that measure in a consistent way to assess specific types of performances. The key to each of these tests is appropriateness, repeatability, and accuracy.
We are sometimes asked how we select the tests we have in benchmarks. The goal is to represent the types of actions that virtualization users are doing on a regular basis. In particular, we focus more on user tasks rather than installation or configuration (because they are typically only done once or infrequently).
In the PC market, PC World (magazine) uses WorldBench as their benchmarking tool of choice. If you don’t know about WorldBench, you can see more at http://www.worldbench.com. WorldBench 6 uses a combination of applications bundled together to determine benchmarks. This includes applications like Adobe Photoshop CS2, Autodesk 3ds, Mozilla Firefox 2, Microsoft Office 2003 and others. This may be a very good way for PC World to approach things as it allows older machines to be part of the mix, and it can avoid possible compatibility issues with the newer and current versions of software, but obviously it’s not reflecting the latest versions of software. It also doesn’t reflect the virtualization part of the experience.
There are a variety of other benchmarks available, and we’ve looked at many of them as possible tools to include in our mix. Often, we find their measurements simply don’t reflect a true user experience. Other times, they don’t reflect how a virtualization user may be using Windows, or even they simply report erroneous results. For example, in previous attempts to use PassMark, we found their graphics scores were not at all representative of real life graphics performance in games or other graphic uses. Those tests showed items as faster when, in fact, they were much slower. Benchmarks are only useful if they reflect the real world.
Rather than use WorldBench or others, we focus on the types of measurements we believe best represent the experience we see (in terms of speed). And while it takes practice and some skill, we test virtualization operations with a stopwatch — as the closest representation of how a real user would see it. CPU crunching ability, for example, is measured through tests like zip’ing files directly in Windows. And for Office users, we use the most up to date version of Microsoft Office for Windows (2010), again with all updates thru the end of September.
There are two exceptions to this: graphics/gaming and CPU utilization. In these two cases, we found that testing utilities not only work well but are necessary to give the most repeatable and concrete results. This time, we had the opportunity to use a tool that measures frames per second to verify the numbers reported by 3DMark06 (the industry standard for tuning gaming systems).
Remember, benchmarks are not a review — they are benchmarks. They are meant to just tell you which runs faster. If you are interested in a specific feature, support, the user interface, or any of the other criteria for deciding on a product, that’s a different article.
Overview
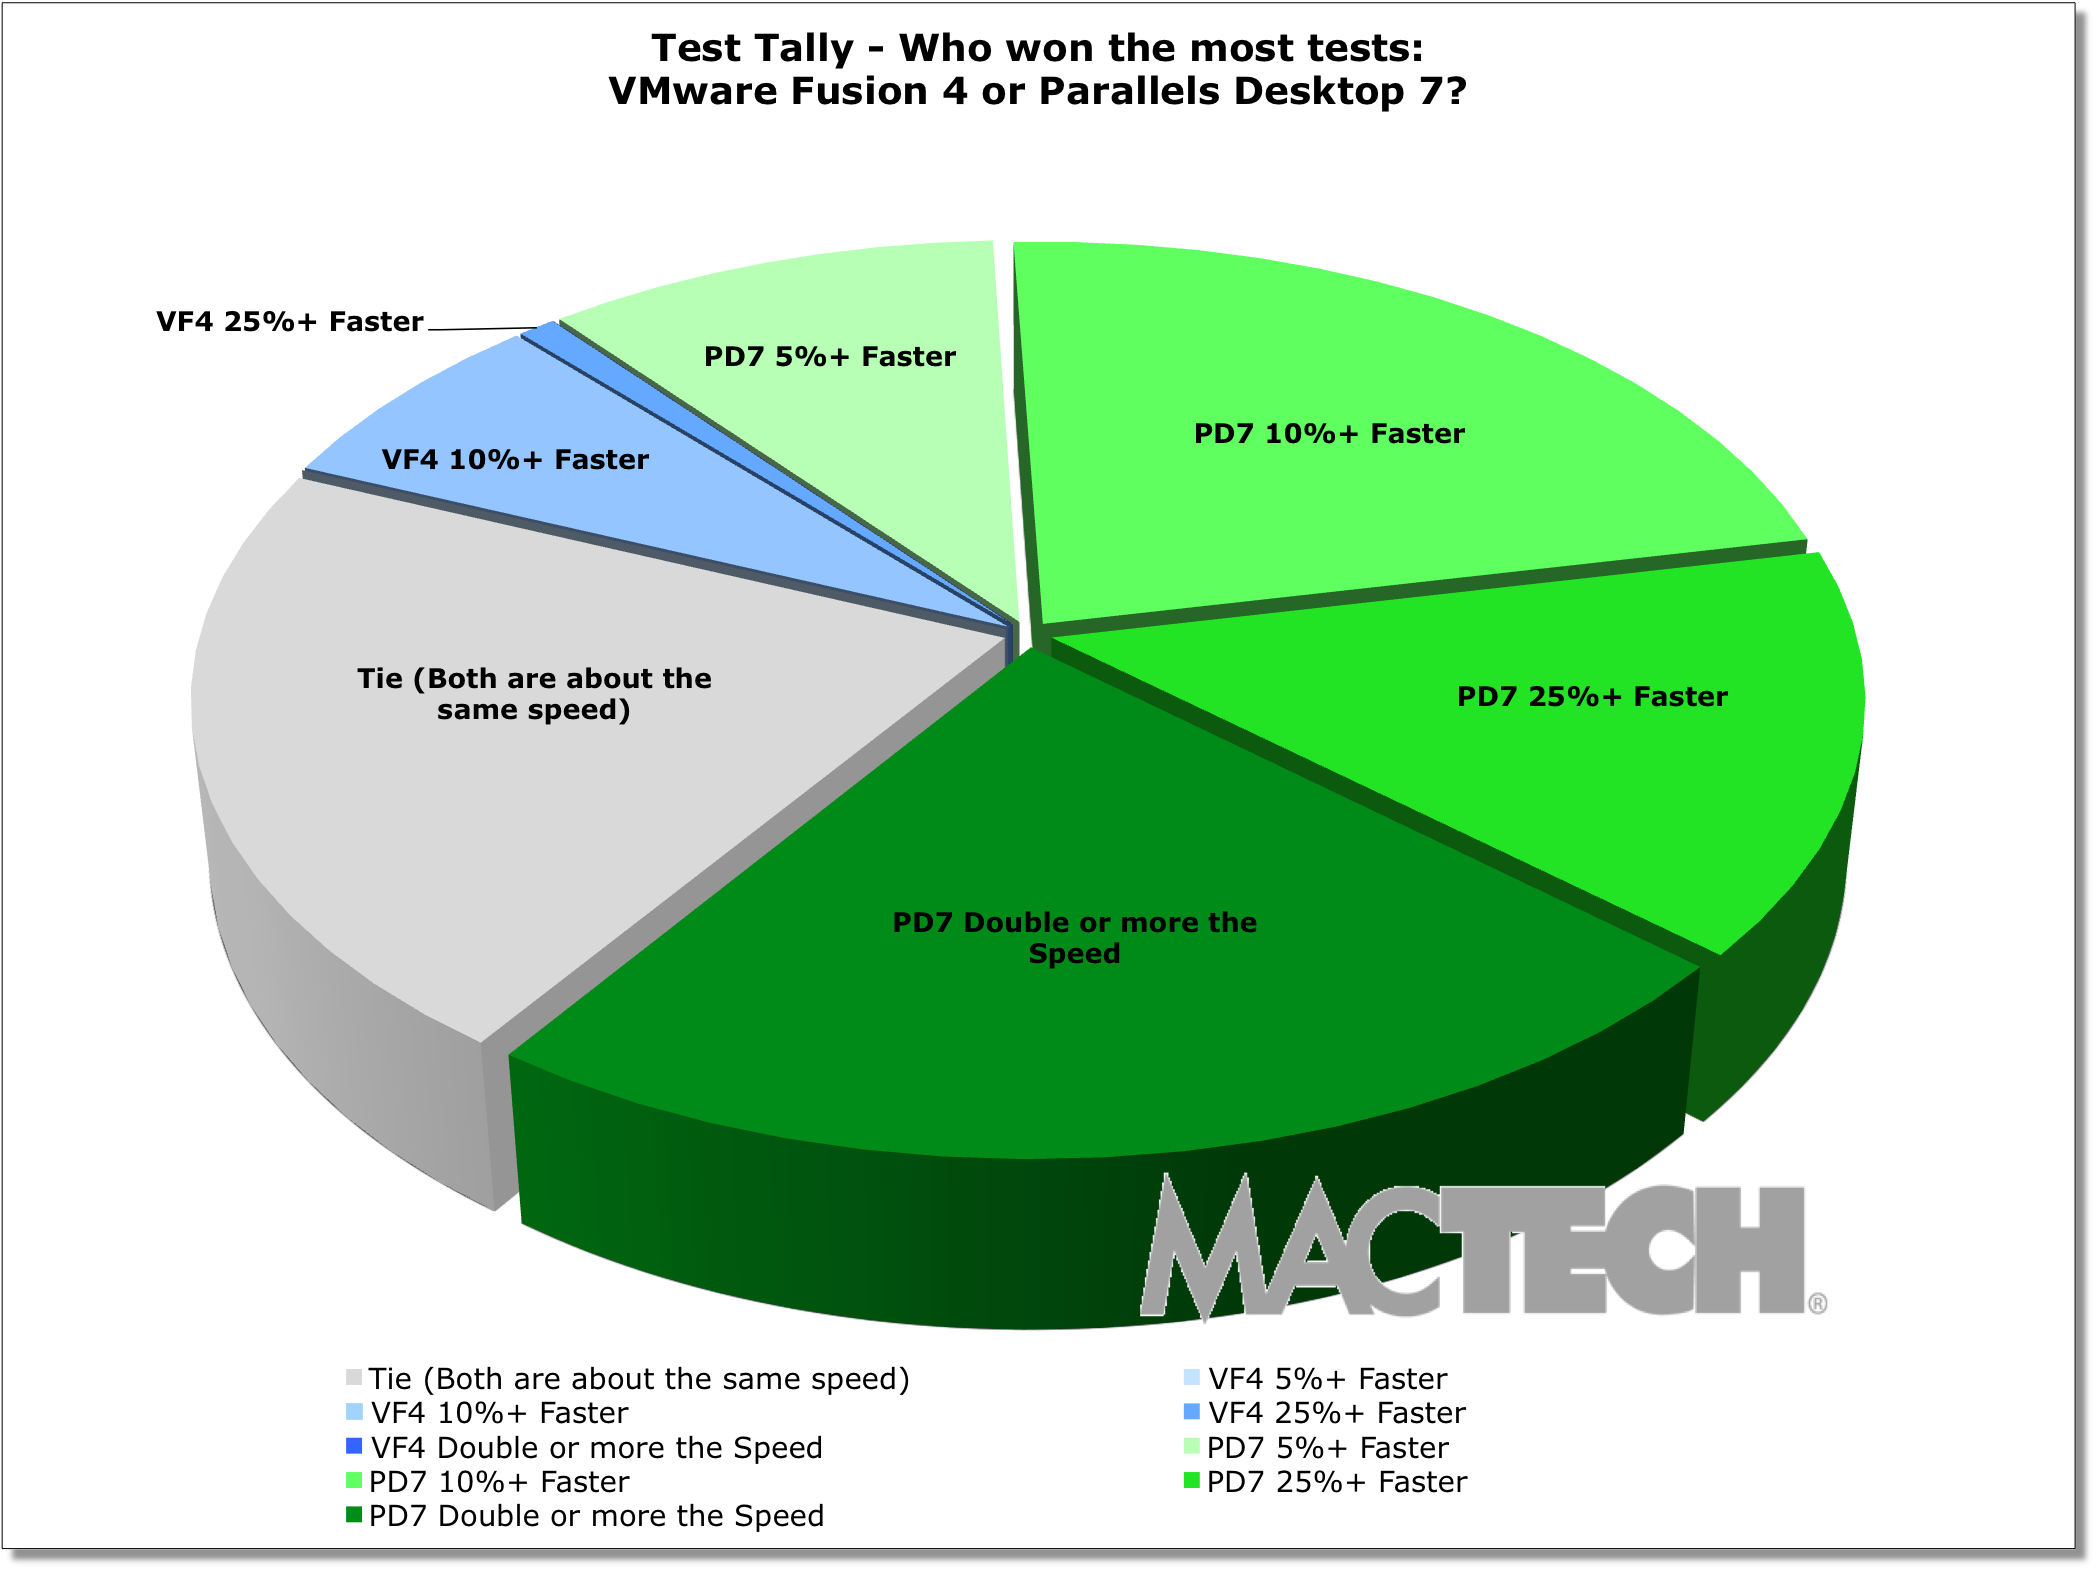
We won’t keep you in suspense. When we look at the “big picture” of all the top-level test results, Parallels is the clear winner. If you count up the general tests (including the top 3D graphics scores), Parallels won 60% of the tests by 10% or more. And, if you include all the tests where Parallels was at least 5% faster, as well as the balance of the 3DMark06 graphics tests, Parallels increased the lead further. In other words, Parallels Desktop 7 beat VMware Fusion 4.0.2 in 74.9% of the general tests we ran, and Parallels was double the speed or more in almost a quarter of the top-level tests.
Test Tally: General Virtualization Tests
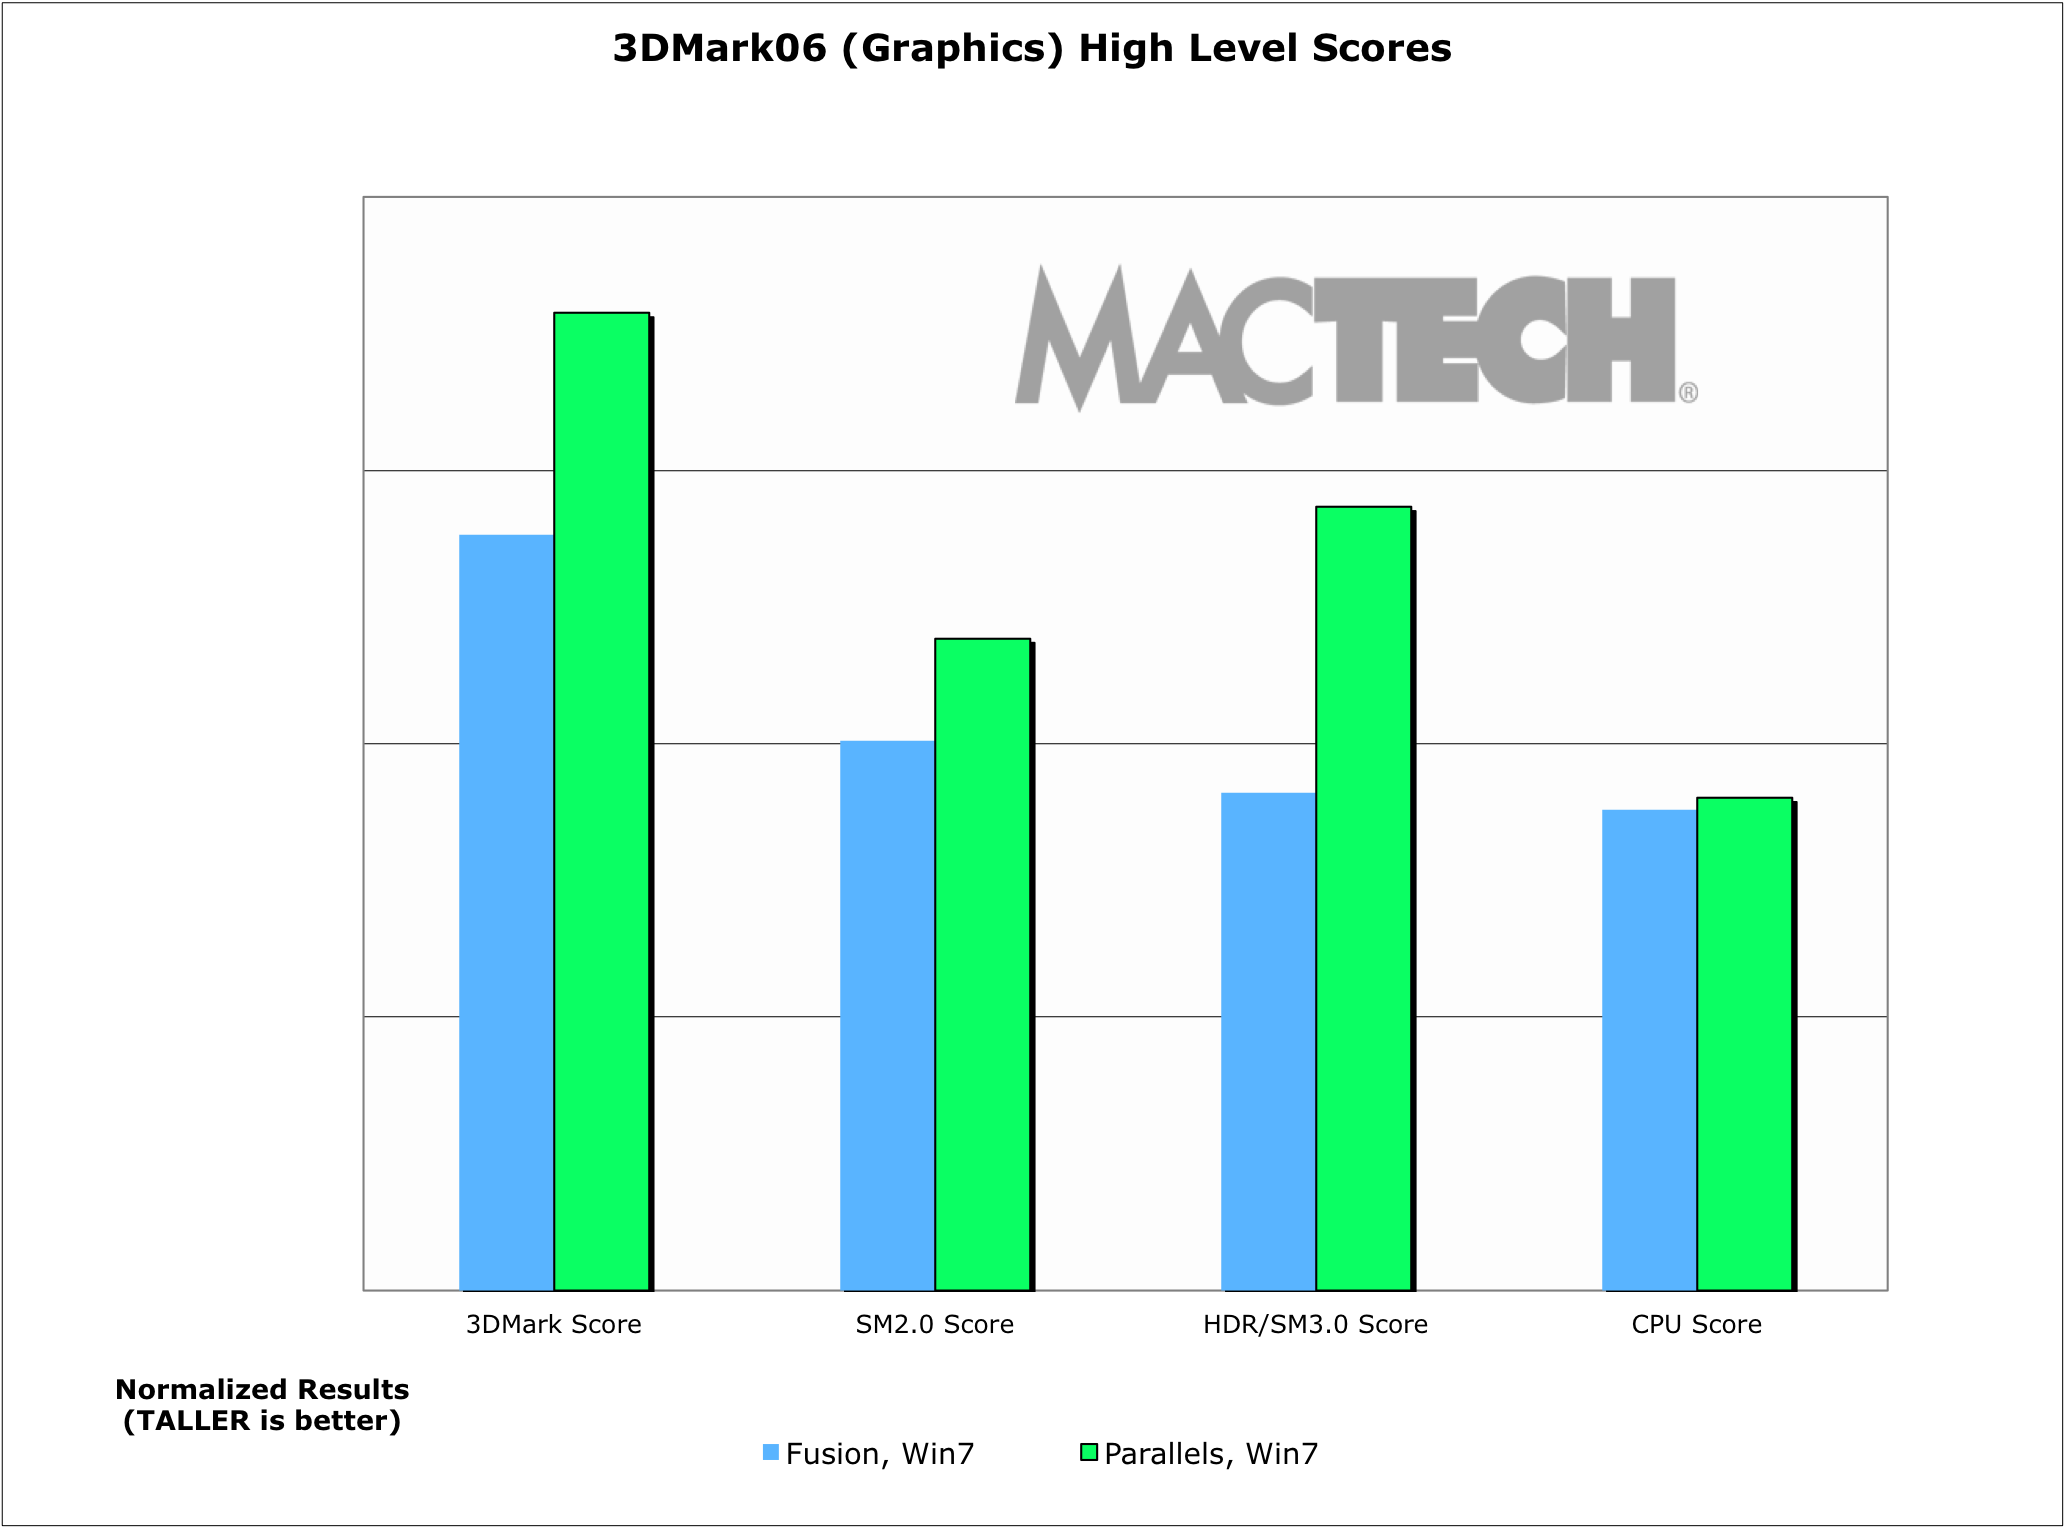
If you focus exclusively on 3D graphics, as measured by 3DMark06 version 1.2, Parallels won by an even larger margin. Specifically, Parallels won 71% of the tests by 10% or more, and was also a bit faster on an additional 8% more of the tests, and tied on the rest. In other words, Parallels Desktop 7 beat or tied VMware Fusion 4.0.2 in all of the 3D graphics tests we ran.
3DMark06 has three main aggregate scores. The most important of which is the “3DMark Score.” In addition, SM2.0 Score measures 3D Shader Model 2.0 performance, and the HDR/SM3.0 Score measures the 3D Shader Model 3.0 & HDR performance.
Test Tally: 3D Graphics Tests
There are a handful of places where VMware Fusion consistently was faster than Parallels Desktop. For example, doing a full Shut Down of Windows 7 was faster in VMware Fusion. And, there were a couple of test configurations for File I/O tests and application launches that VMware was definitely faster, but Parallels was also faster in other instances of similar tests.
Overall, of the top-level tests, VMware Fusion won 7.8% of the tests by at least 10%. For the 3D tests, VMware Fusion never beat Parallels, but tied about 20% of the time. There’s no doubt that VMware Fusion 4 is significantly better in graphics than version 3.1, but it still has not caught up to Parallels Desktop.
Parallels Desktop has new power management features that stretch your battery life. On the MacBook Pro, we saw about 25% more battery time on an idling virtual machine (which results in 81 additional minutes of use) than we did on VMware Fusion in the same test.
One of the best ways to visualize the huge amount of data points is through MacTech’s well-known “Colored Cell Worksheet Overview.” In these worksheets, a cell represents the best result for each test for each version of Windows for each virtualization product. These are then colored according to which product was faster.
Green cell coloring means Parallels Desktop was faster than VMware Fusion. A blue cell coloring indicates VMware Fusion was faster than Parallels Desktop. Scores that were within 5% of one another are considered a tie. Coloring darkness has four thresholds: >5%, >10%, >25% and double the speed or more. (Note: Not all tests were run on all configurations, hence the empty cells.)
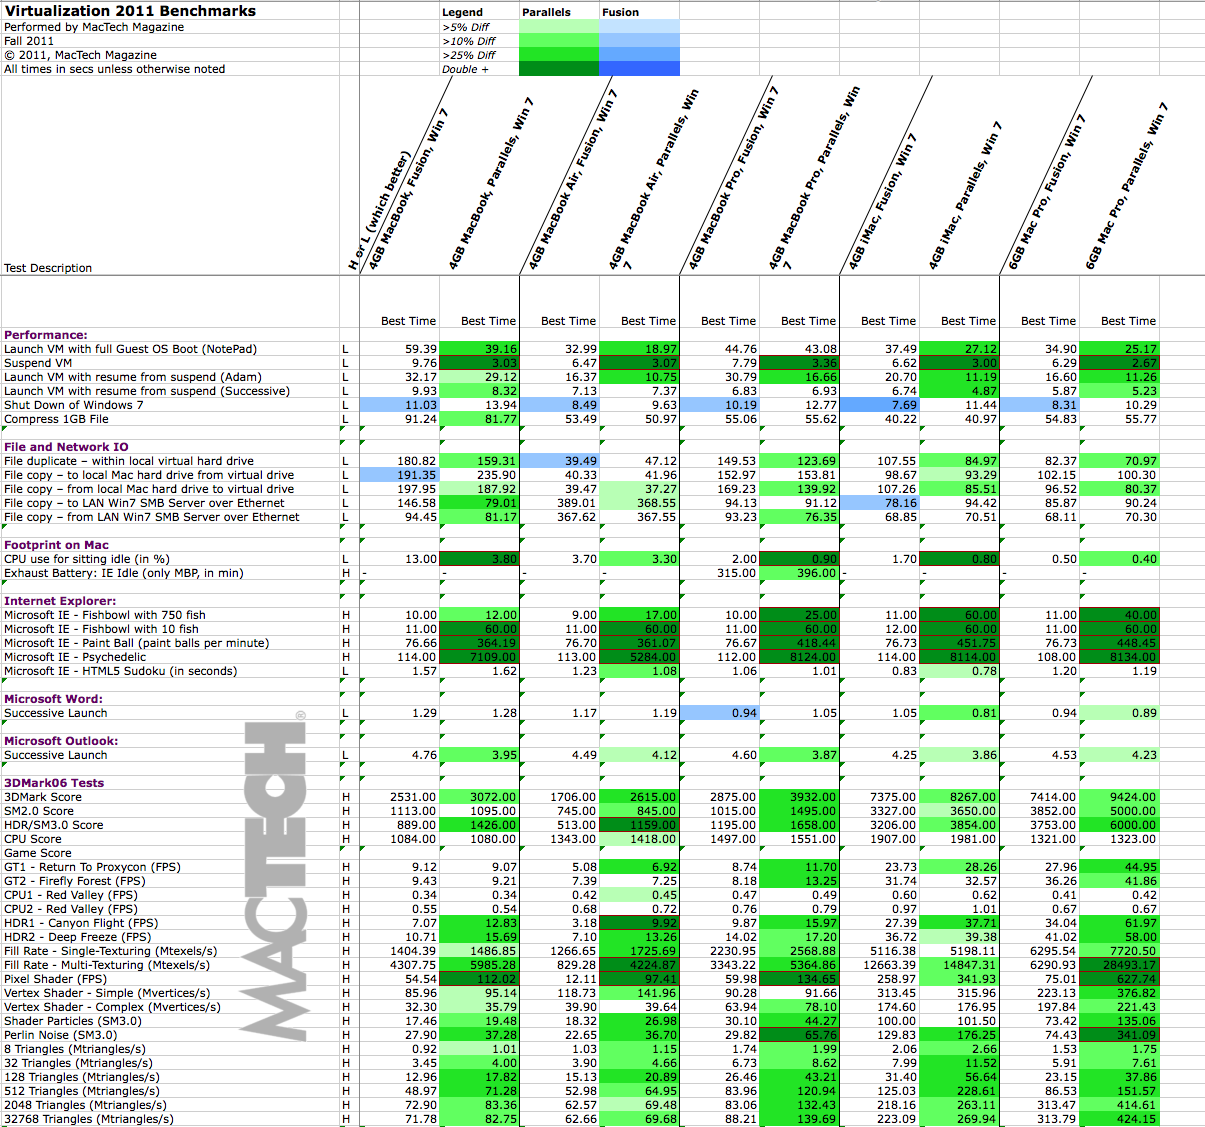
Colored Cell Worksheet Overview: Virtual Hard Drive
Obviously, when you look at the amount of green on the worksheet, you can see that Parallels was faster in the vast majority of tests that we ran.
The Test Suite and Results
In the sections below, we’ll walk you through what we tested, and the results for each. These tests are designed to arm you with the information so you can make the best decision for your type of use.
For each set of results, you can see the analysis for each model of computer running Windows 7. If you want to see more detail on the tests or on an individual Mac model, you may want to review the spreadsheet for those details.
As you look through the charts below, pay attention to whether the better result is represented by taller or shorter bars (see the lower left corner of each chart).
For the launch tests (launching the VM, Booting Windows, and Suspend/Resume), we had the option of an “Adam” test and a “Successive” test. Adam tests are when the computer has been completely restarted (hence avoiding both host and guest OS caching). Successive tests are repeated tests without restarting the machine in between tests, and can benefit from caching. Both can mimic real use situations depending on a user’s work habits.
The tests used were selected specifically to give a real-world view of what VMware Fusion and Parallels Desktop are like for many users. We didn’t focus on the tests which were so short in time frame (e.g., fast) that we could not create statistically significant results, or that had unperceivable differences.
For some of the analysis, we “normalized” results by dividing the result by the fastest result for that test across all the machine configurations. We did this specifically so that we could make comparisons across different groups, and to be able to give you overview results combining a series of types of tests, and computer models.
Instead of a plain “average” or “mean”, overall conclusions are done using a “geomean”, which is a specific type of average that focuses on the central results and minimizes outliers. Geomean is the same averaging methodology used by SPEC tests, PCMark, Unixbench, and others, and it helps prevent against minor result skewing. (If you are interested in how it differs from a mean, instead of adding the set of numbers and then dividing the sum by the count of numbers in the set, n, the numbers are multiplied and then the nth root of the resulting product is taken).
For those interested in the benchmarking methodologies, see the more detailed testing information in Appendix A. For the detailed results of the tests used for the analysis, see Appendix B. Both appendices are available on the MacTech web site.
Launch and CPU Tests
There are three situations in which users commonly launch a virtual machine:
- Launch the virtual machine from “off” mode, including a full Windows boot and ending with launching of an application. For testing purposes, we chose the NotePad application.
- Launch the virtual machine from a suspended state, and resume from suspend (Adam).
- Launch the virtual machine from a suspended state, and resume from suspend (Successive).
For the first test, we started at the Finder and launched the virtualization applications, which were set up to immediately launch the virtual machine. The visual feedback is fairly different between Parallels Desktop and VMware Fusion when Windows first starts up. Windows actually does its startup for quite some time after reaching the desktop. In some cases, it can take quite some time for Windows to complete its boot process. Most users don’t care if things continue so long as they aren’t held up.
As a result, we focused on timing to the point of actually accomplishing something. In this case, we configured NotePad to automatically launch. The test ended when the window started to render. This gave us a real world scenario of being able to actually do something as opposed to Windows just looking like it was booted.
The primary difference between the two types of VM launch test is that the computer is fully rebooted (both the virtual machine as well as Mac OS X) in between the “Adam” tests. The successive tests are launching the virtual machines and restoring them without restarting the Mac in between.
Successive tests benefit from both Mac OS X and possibly virtual machine caching and are significantly faster. However, you may only see these types of situations if you are constantly switching in and out of your virtual machine.
As with all of our tests, we performed these tests multiple times to handle the variability that can occur. Of those results, we took the best results for each product.
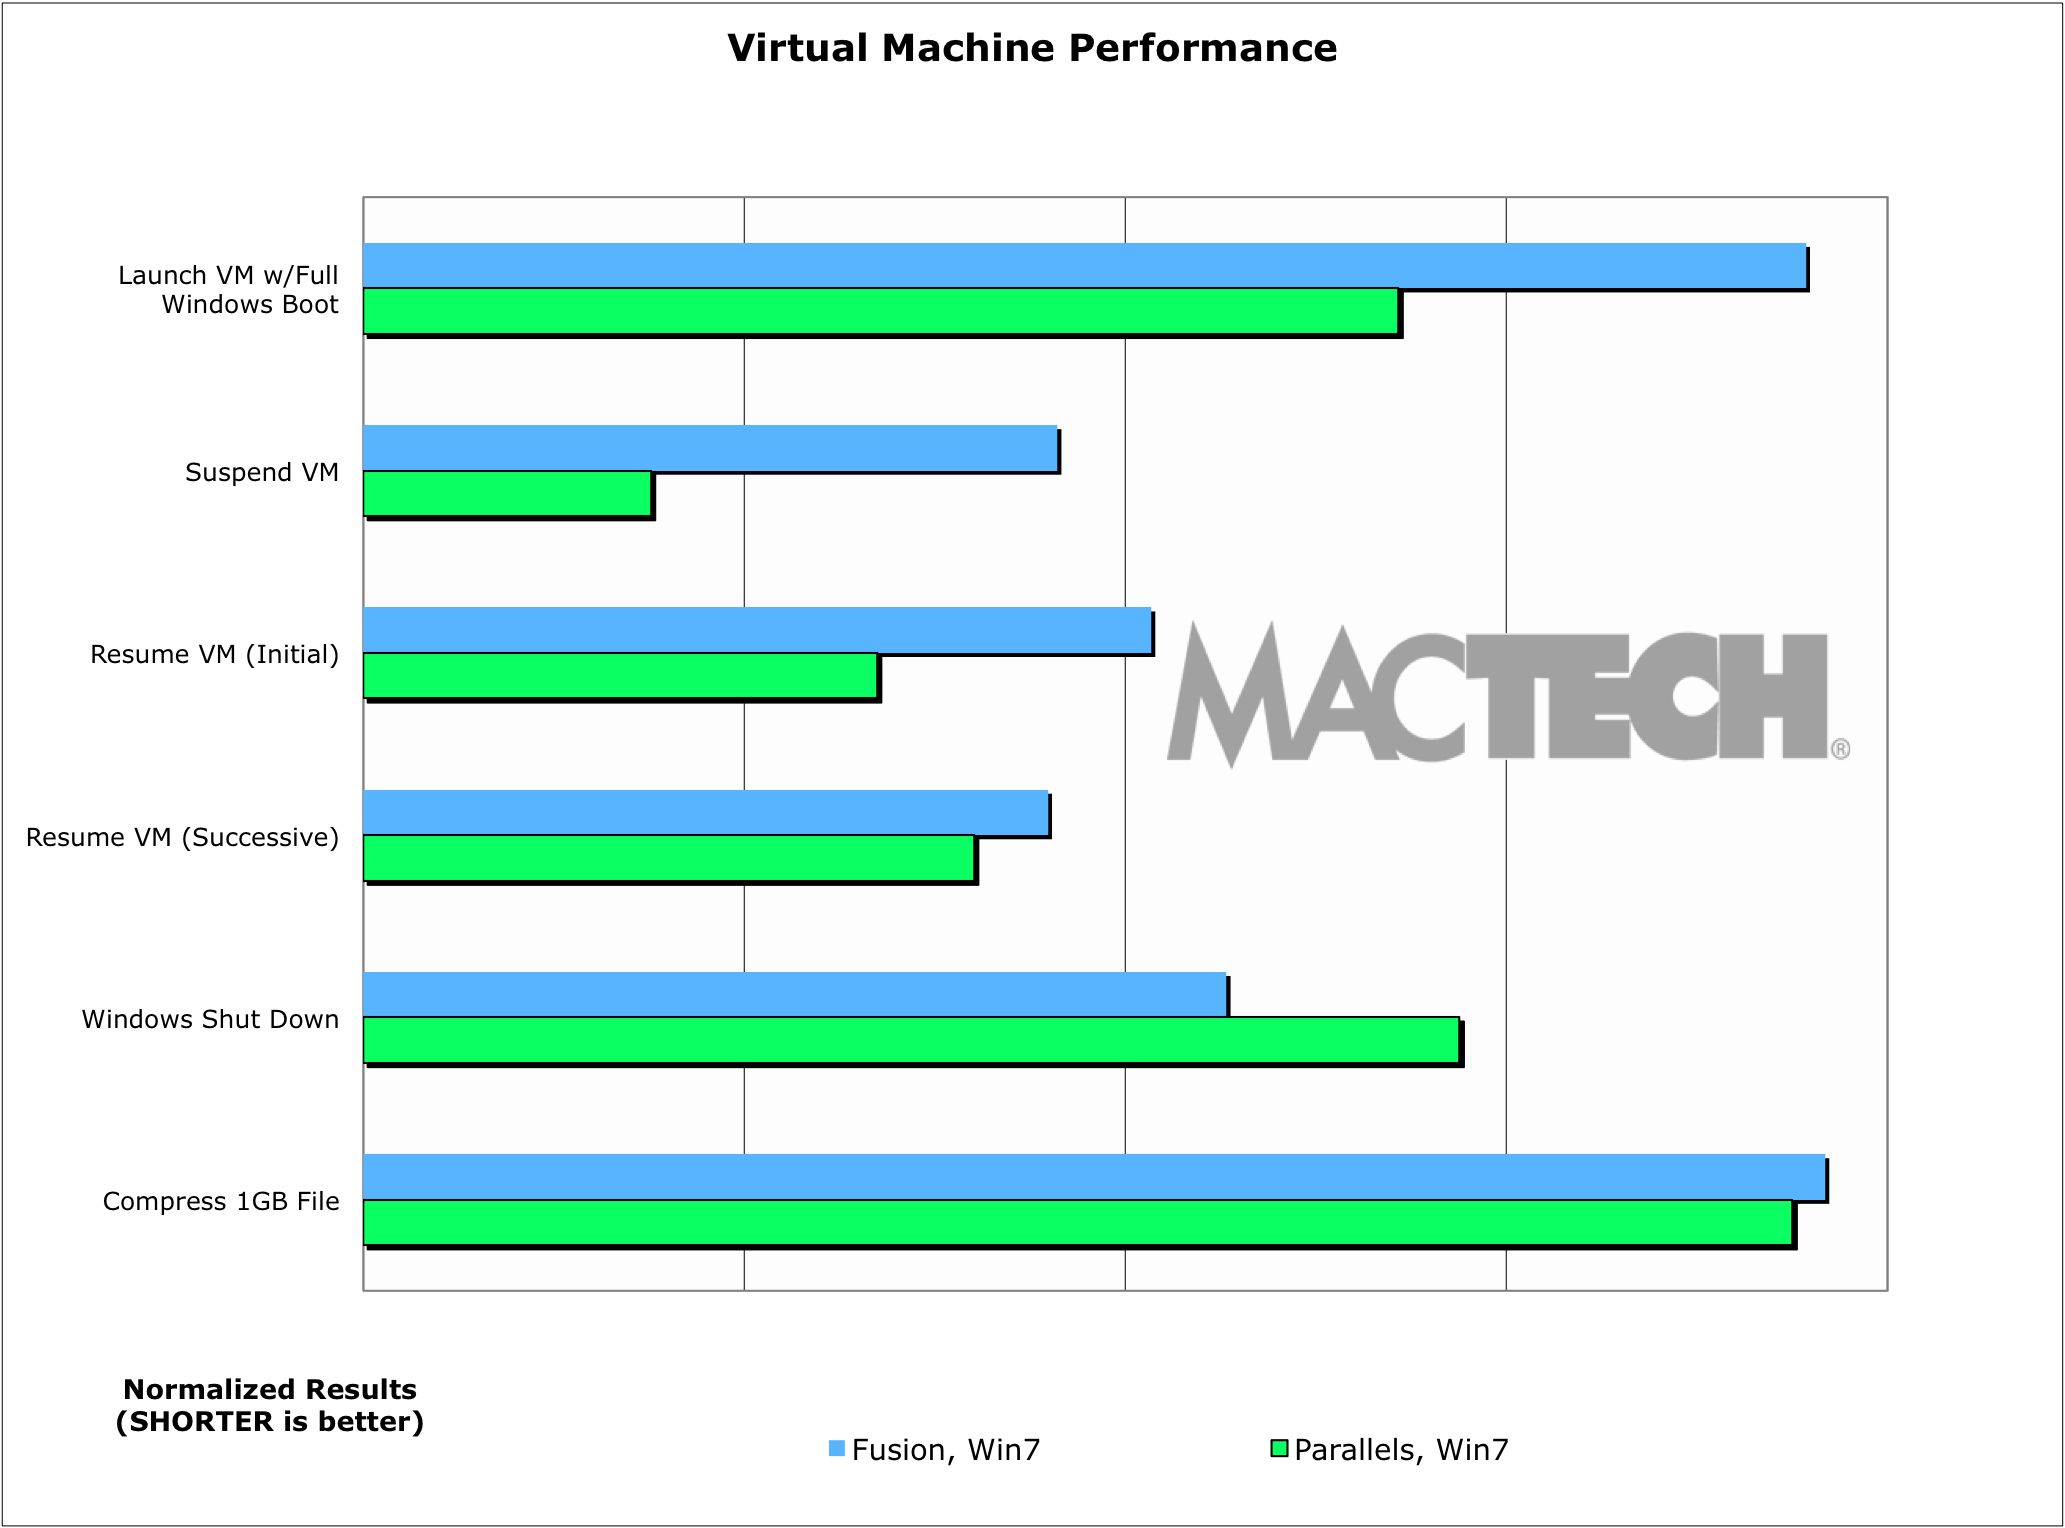
Virtual Machine Performance
Clearly, virtual machines with more vm memory take longer to restore, so “more” is not necessarily better here. Use the smallest amount that does what you need to do well. In our case, we focused on 1 GB virtual machines in Windows 7.
Most benchmarking suites measure CPU performance using file compression as at least one part of their analysis. We did the same. As a matter of interest, we used compression instead of decompression, because with today’s fast computers, decompression is actually much closer to a file copy than it is to CPU work. Compression requires the system to perform analysis to do the compression, and is therefore a better measurement of CPU.
The two solutions are very close to one of another with Parallels having the slightest edge in speed in compression, but nothing substantial.
Application Launch Test
Here, we tested two of the most common applications used in virtualized desktop environments: Microsoft Office 2010’s Word and Outlook. Users often go in and out of Word and Outlook, so we focused on successive launches. Similar to the OS launch tests, a successive launch test is done repeatedly without restarting Windows.
Most applications, including these, launch very quickly, with Parallels having a slight edge. Even so, launches are so fast on both virtualization products that even the worst case was very usable.
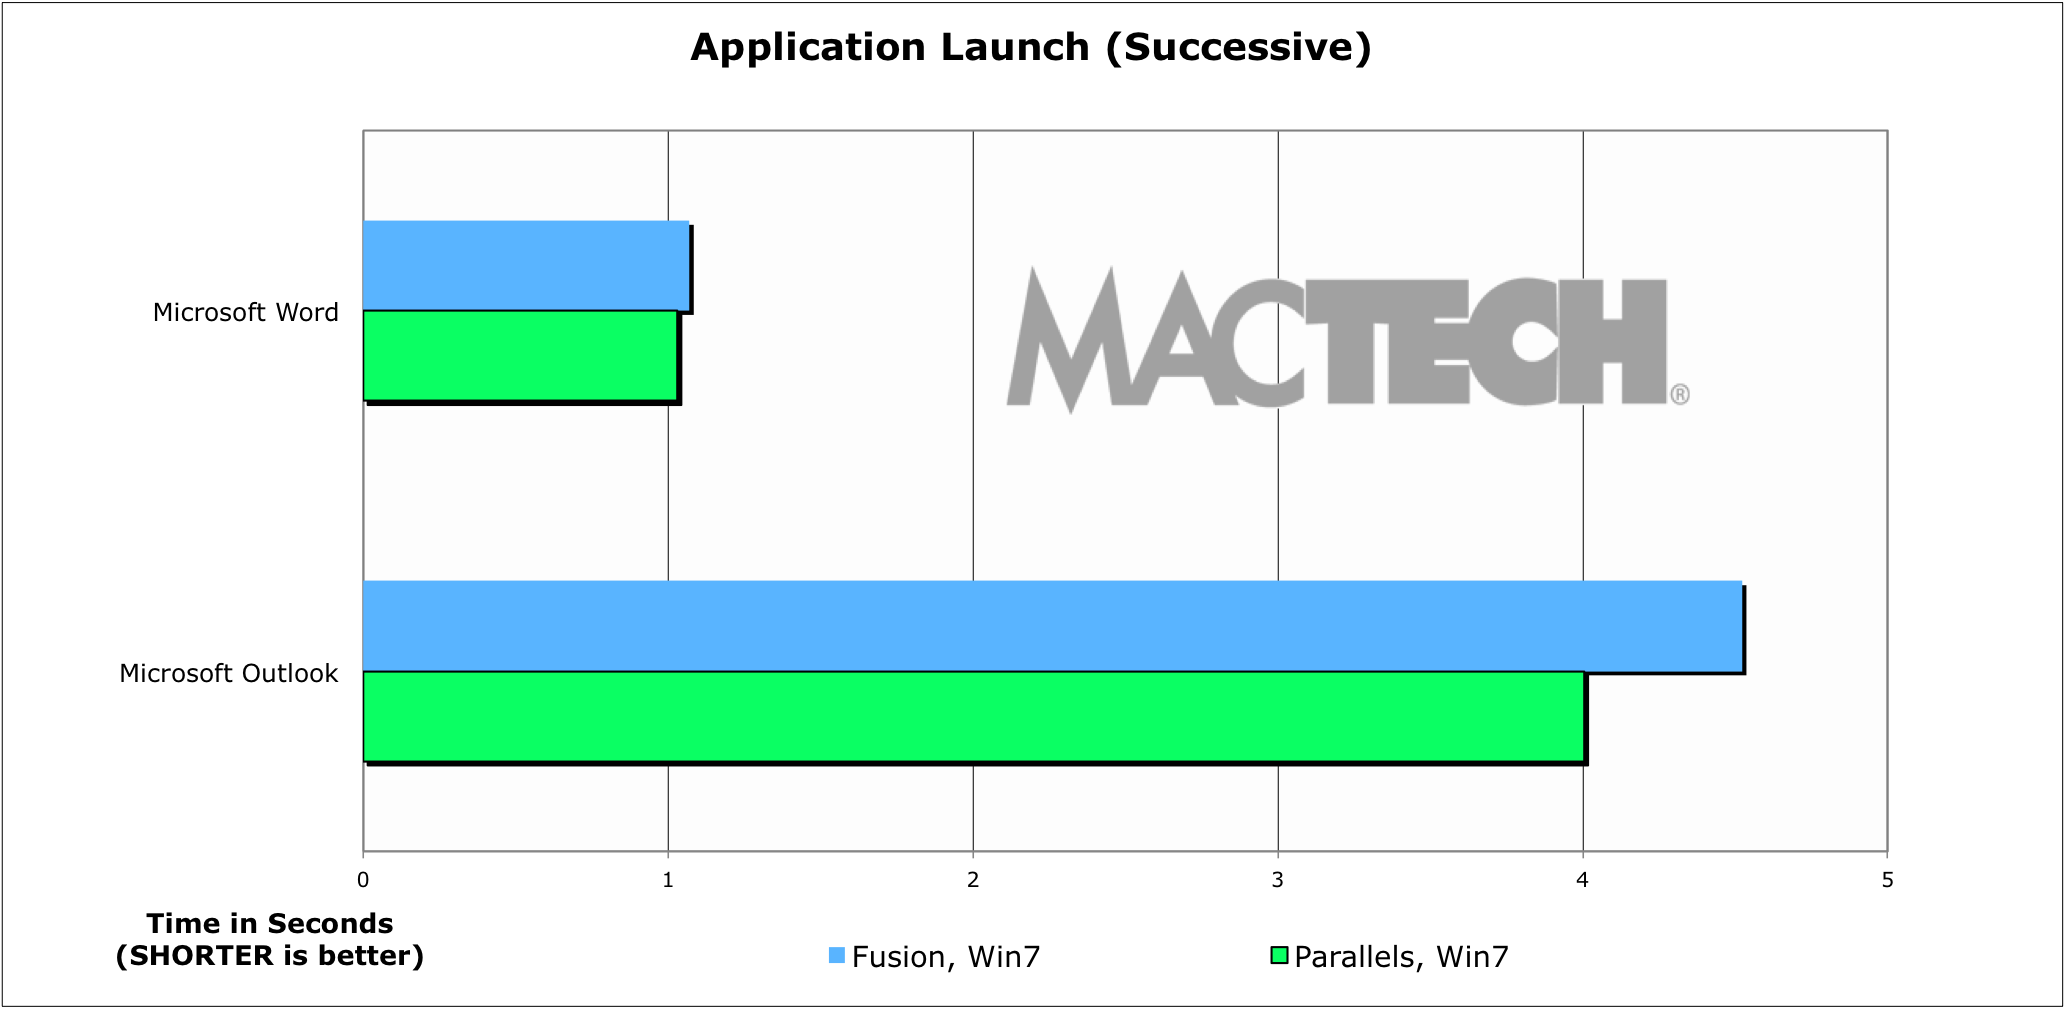
Windows Application Launch Performance
In all cases, launch times were quite fast from a user experience. It’s nice to see that all the Microsoft Office applications launch (typically) in a few seconds under both Parallels Desktop and VMware Fusion. Often, it felt nearly instantaneous to a user on the successive launches.
Application Performance Tests
In many cases, applications today perform so well and so fast, even under virtualized environments, that anyone would be pleased for small documents and activities. We focused our efforts on one of the more demanding and used applications: Internet Explorer 9.
Microsoft has a series of public benchmarks for seeing how well a browser performs. See http://ie.microsoft.com/testdrive/Views/SiteMap/ for all kinds of demos and performance tests. We chose a set of tests that took enough resources to measure well and had a consistent method of measurement.
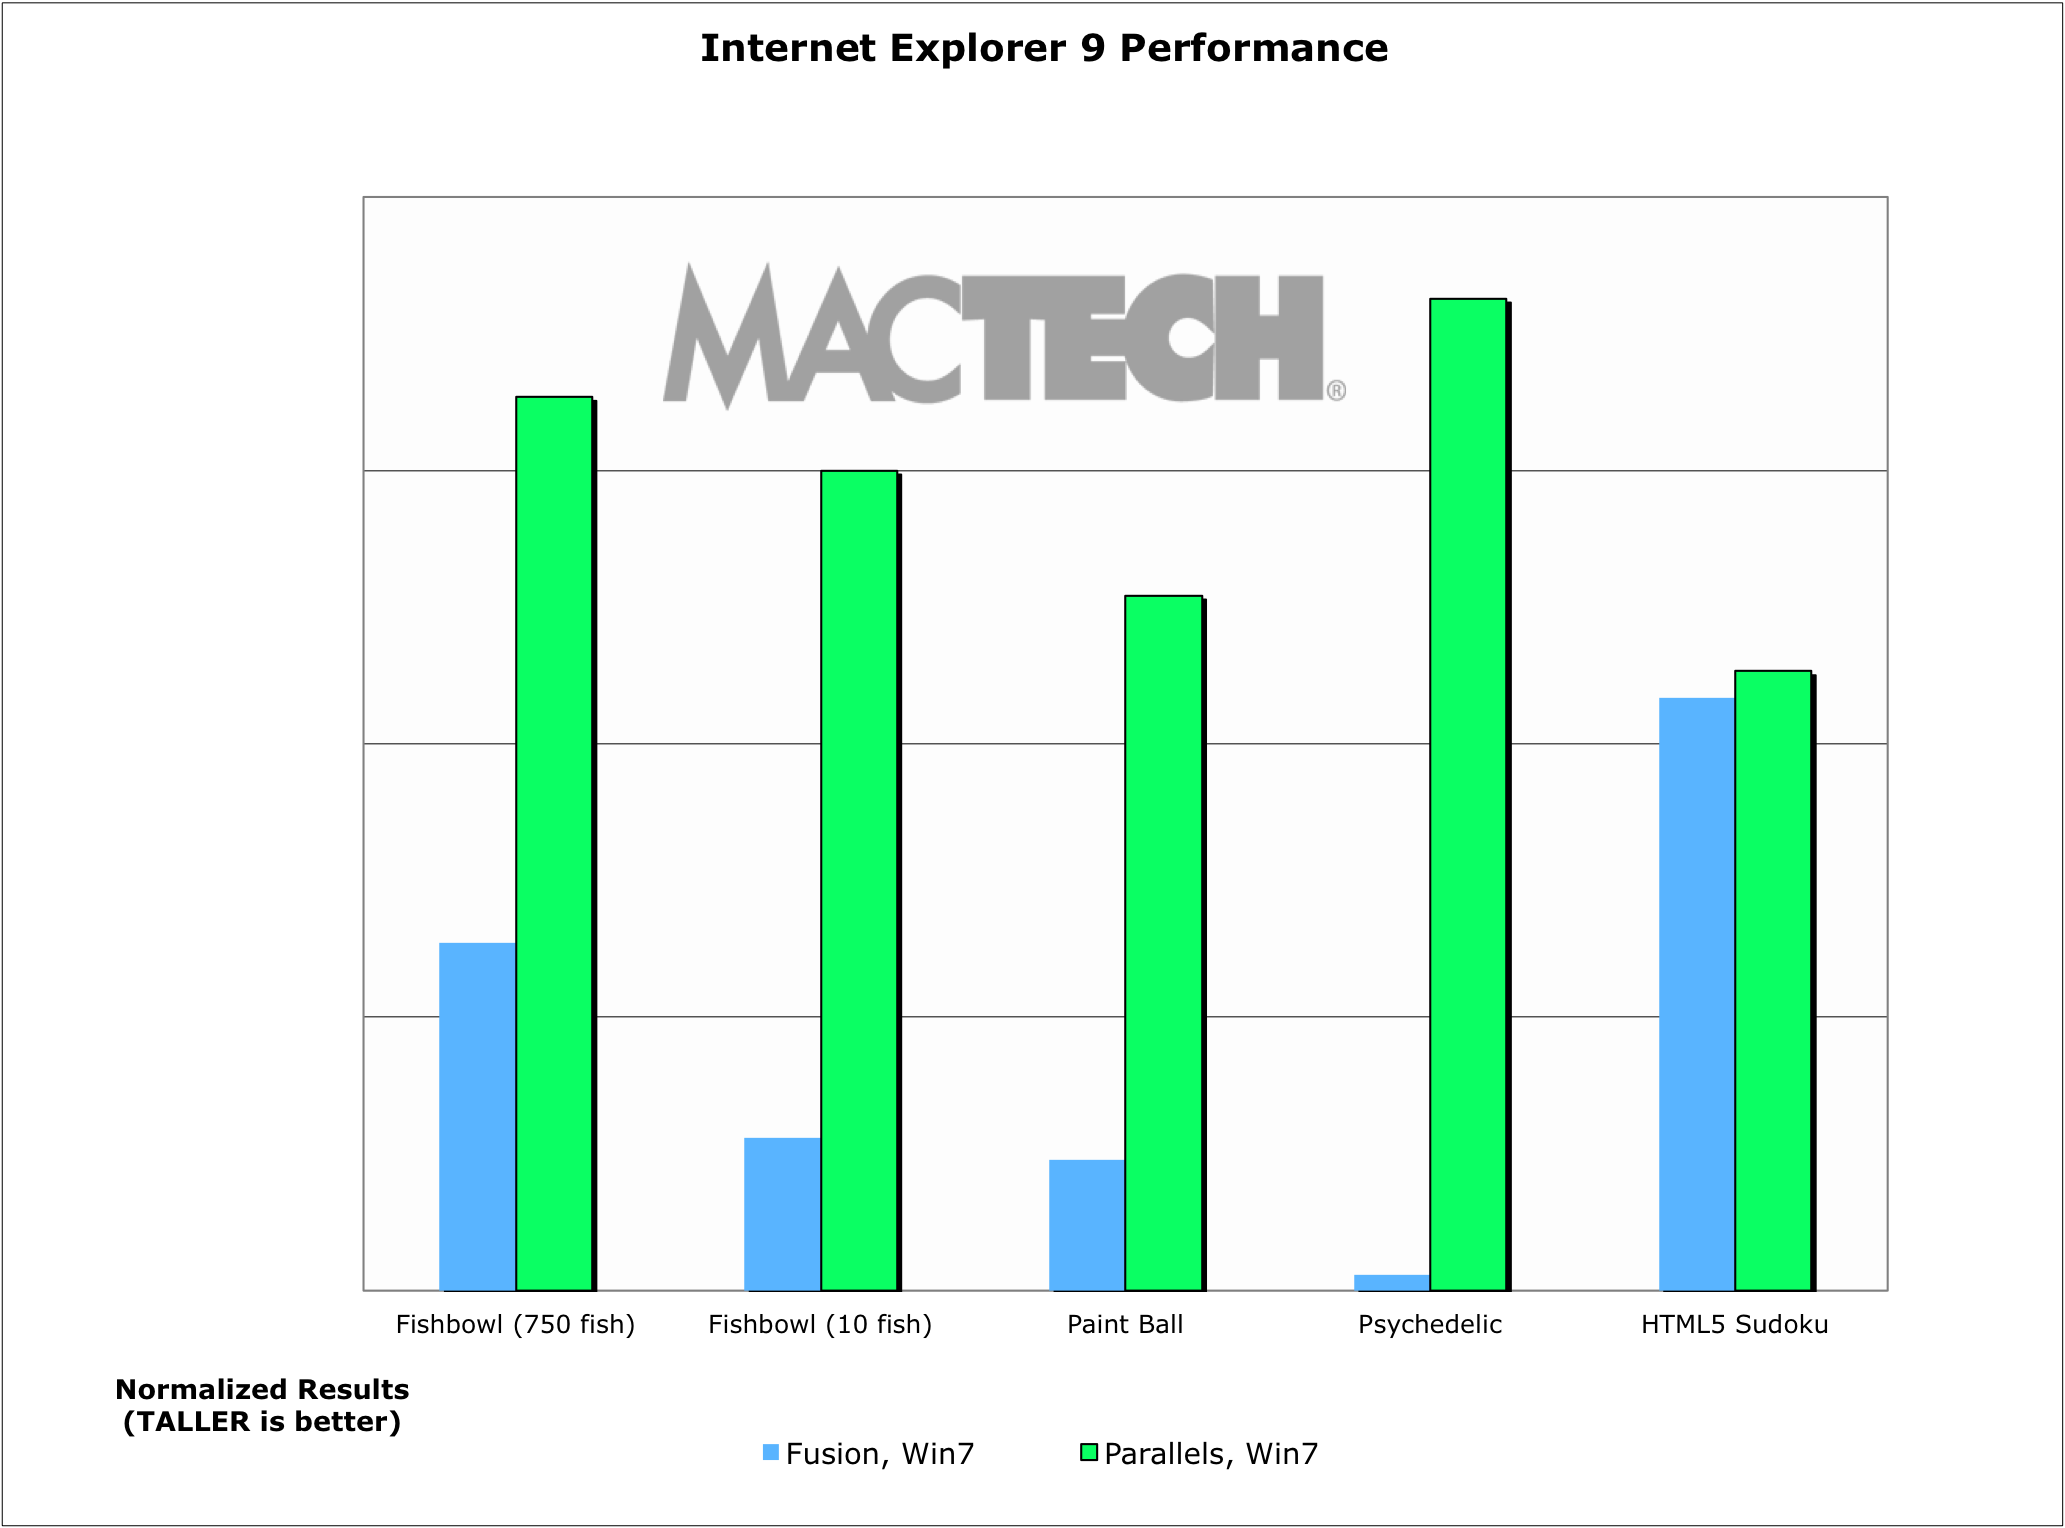
Internet Explorer Performance
Across the board, Internet Explorer 9 performed significantly better on Parallels Desktop than it did on VMware Fusion. Only the Sudoku test was close at all. All the rest were a virtual blowout (sorry, couldn’t resist).
Interestingly, VMware Fusion often performed very consistently from one model of Mac to another despite some models being much faster machines. That said, some tests did not perform well enough to move to the next phase of the test. The best example was the Psychedelic test which gave the following two messages.

VMware Fusion had issues with the Psychedelic test

Parallels Desktop ran the Psychedelic test well
Because the web is becoming more and more an application platform, we chose to focus on more advanced Web 2.0 technologies rather than simple html.
VMware tells us “IE9 specifically disables hardware acceleration of graphics with VMware and other select Microsoft third party compliant hypervisors. See Microsoft blog here from March 2011: http://windowsteamblog.com/windows/b/bloggingwindows/archive/2011/03/13/internet-explorer-9-hardware-acceleration-and-third-party-hypervisors.aspx . While Microsoft believes they fixed this IE9 hardware acceleration issue in Microsoft certified third party compliant hypervisors, it is still unresolved and we are working though this issue with them. This does not affect non-Microsoft certified hypervisors and is an IE/Microsoft limitation. If you run Google Chrome and run the same HTML5 tests in a virtual machine, you will see hardware acceleration of it in a browser in Windows in a VMware virtual machine.” In other words, this may change for VMware in the future, but at the moment, the above is what we are seeing for IE9 performance.
Footprint Tests
One of the most interesting things in the virtualization market is how little overhead virtualization takes today compared to what it used to. To assess this, we measured in a variety of ways. Specifically, we focused on CPU usage (overall for the Mac), which has an impact not only on usability but also, on laptops, how long the battery would last. CPU usage was measured using “top” (a command line tool that’s part of UNIX with a minimum of 50 continuous samples averaged for the result). For all tests, we removed the high and low use outliers to give a more typical impact.
While Parallels did use substantially less CPU when you look at percentages, in reality, they both took so little of the CPU (except for VMware Fusion on a MacBook), that you can really let these apps sit idly and not worry about it bogging down your machine.
Battery Tests
With Apple making it impossible to swap your batteries in the latest laptops, battery life is more important than ever. VMware Fusion relies primarily on the Mac OS and Windows settings to manage battery life. Parallels, however, has some special features to help you stretch battery life.
The result is noticeable. In our tests, Parallels got 25% more battery life on a virtual machine sitting idle than VMware Fusion. This was 81 more minutes of battery life on the MacBook Pro. If you are using your virtual machine for typing in Word, or using Excel, this is a reasonable approximation. That said, if you are “pegging” the CPU on your machine, or using an optical drive or hard drive, the difference will be less. For most travelers, the light CPU impact of Word/Excel use is probably what they are using a virtual machine for.
File and Network IO Tests
One of the common problems with File and Network IO Tests is caching. In fact, it’s common for benchmarkers to think they are avoiding caching when in fact, they aren’t. In the case of File and Network IO tests, there are two types of caching: in the host OS and in the guest OS. Furthermore, sometimes the caching can appear to happen even after restarts of both the host and guest OS.
In our tests, we used a set of four different 1 GB files with random data to give the most representative results and avoided caching. More specifically:
- 1 GB file with randomized data. To generate the file of exactly 1 GB, we used the command dd if=/dev/random from the command line.
The idea behind the “document set” is to move enough data that we can see both real throughput and avoid caching at all levels.
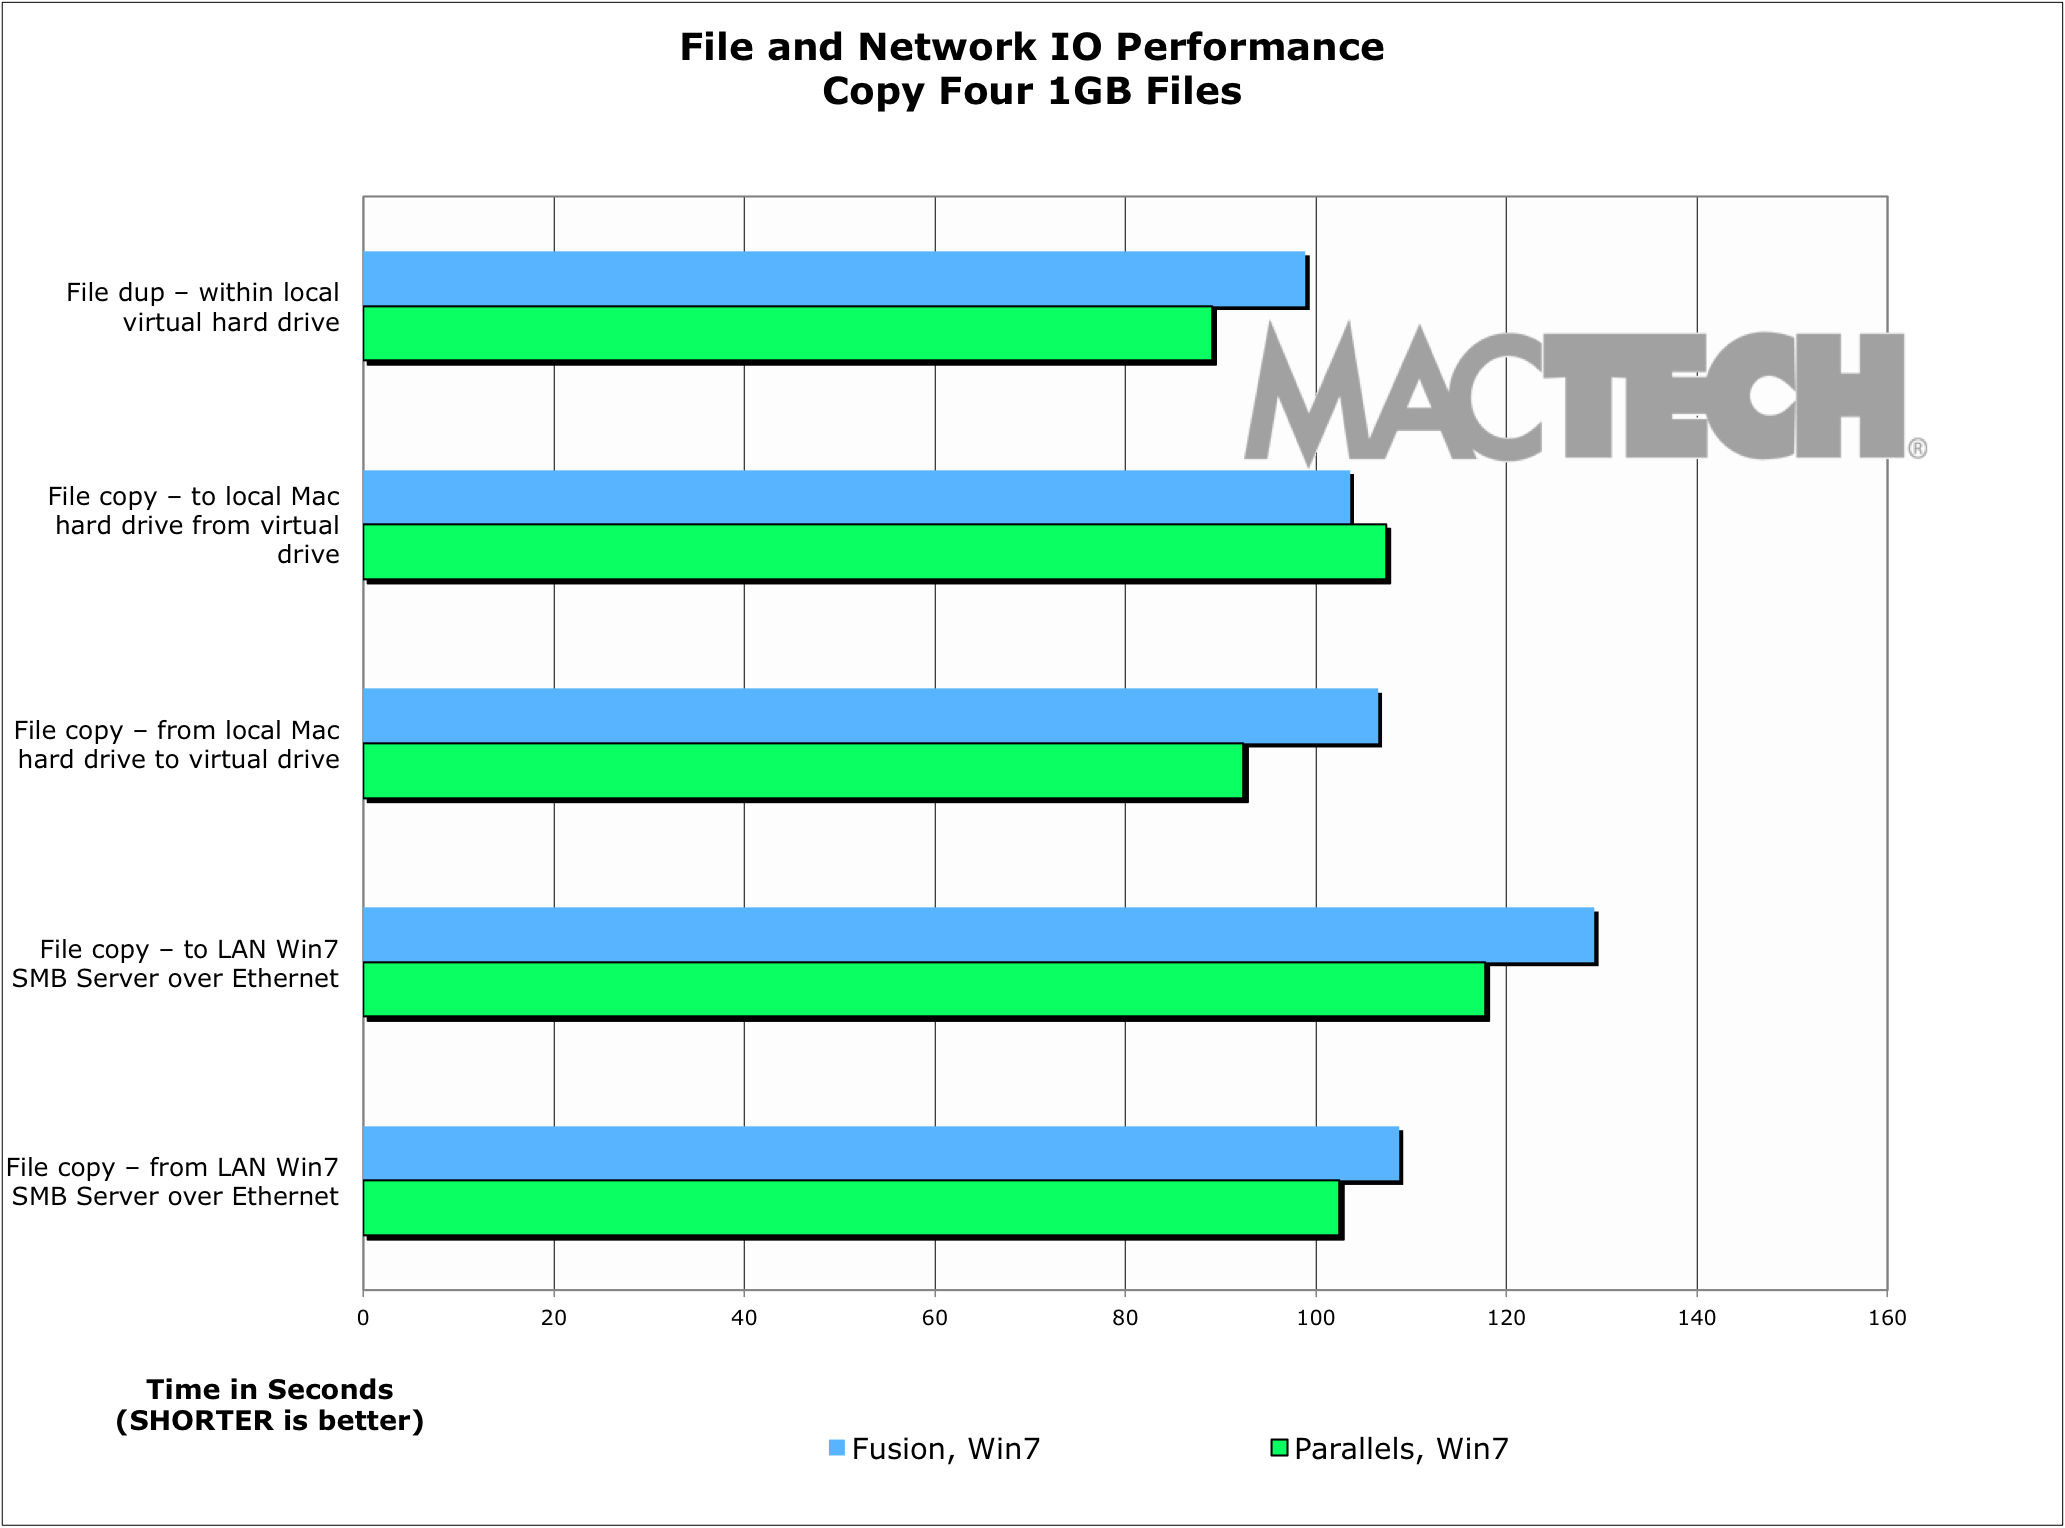
Virtual Machine File I/O Performance
We were a bit surprised to see the results given the past performance of these two products, and what both companies had told us about the areas they focused on. After digging around some we found a surprise.
Surprise! You have MSSE
If you have Office 2010 installed, and Windows Update configured to do updates, you’ll notice Microsoft Security Essentials is now part of the Optional Updates. This is important to take note of as it will have an impact on basically anything that touches the disk (boot times, compress, network copies to disk, and more). In fact, in the current versions of PD7, it eliminates some of the speed margin we’ve seen in the past when compared to VF4. VF4 did not seem to be impacted, or at least as much.
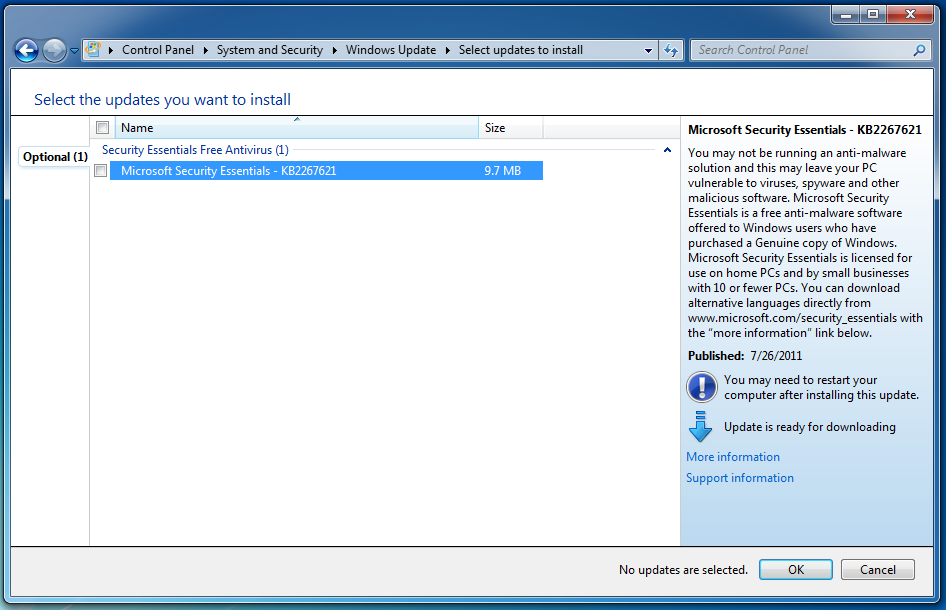
MSSE now part of the optional installations
So, if you are a true speed demon, you may want to remove Microsoft Security Essentials. Since all of our tests were done with all updates applied, including the installation of Microsoft Security Essentials, your speed may be even faster on Parallels.
Of course, if you are worried about security, then keeping MSSE installed is the way to go and I would guess that Parallels will likely address the lost speed in the future anyway.
3D Graphics Tests
We’re always on the lookout for new ways to measure graphics in particular. And this time, again, we did look at some of the results of other benchmark suites, and found that their assessment of graphics were very clearly wrong (we could clearly see visually they weren’t right).
As a result, we again used 3DMark06 (version 1.2) by FutureMark. 3DMark06 is a globally recognized and comparable measurement of 3D performance. Gamers use 3DMark to test their machines and tweak them for performance. See http://www.futuremark.com/ for more information about 3DMark06.
Clearly, if you are going to play games and be serious about it, then running in Boot Camp is your best choice running Windows natively. However, Parallels Desktop is fairly close and with a virtualization solution you don’t have to reboot, deal with driver issues, and more. We were pleased to see that VMware Fusion 4.0.2 no longer has the rendering problems that it did in prior versions.
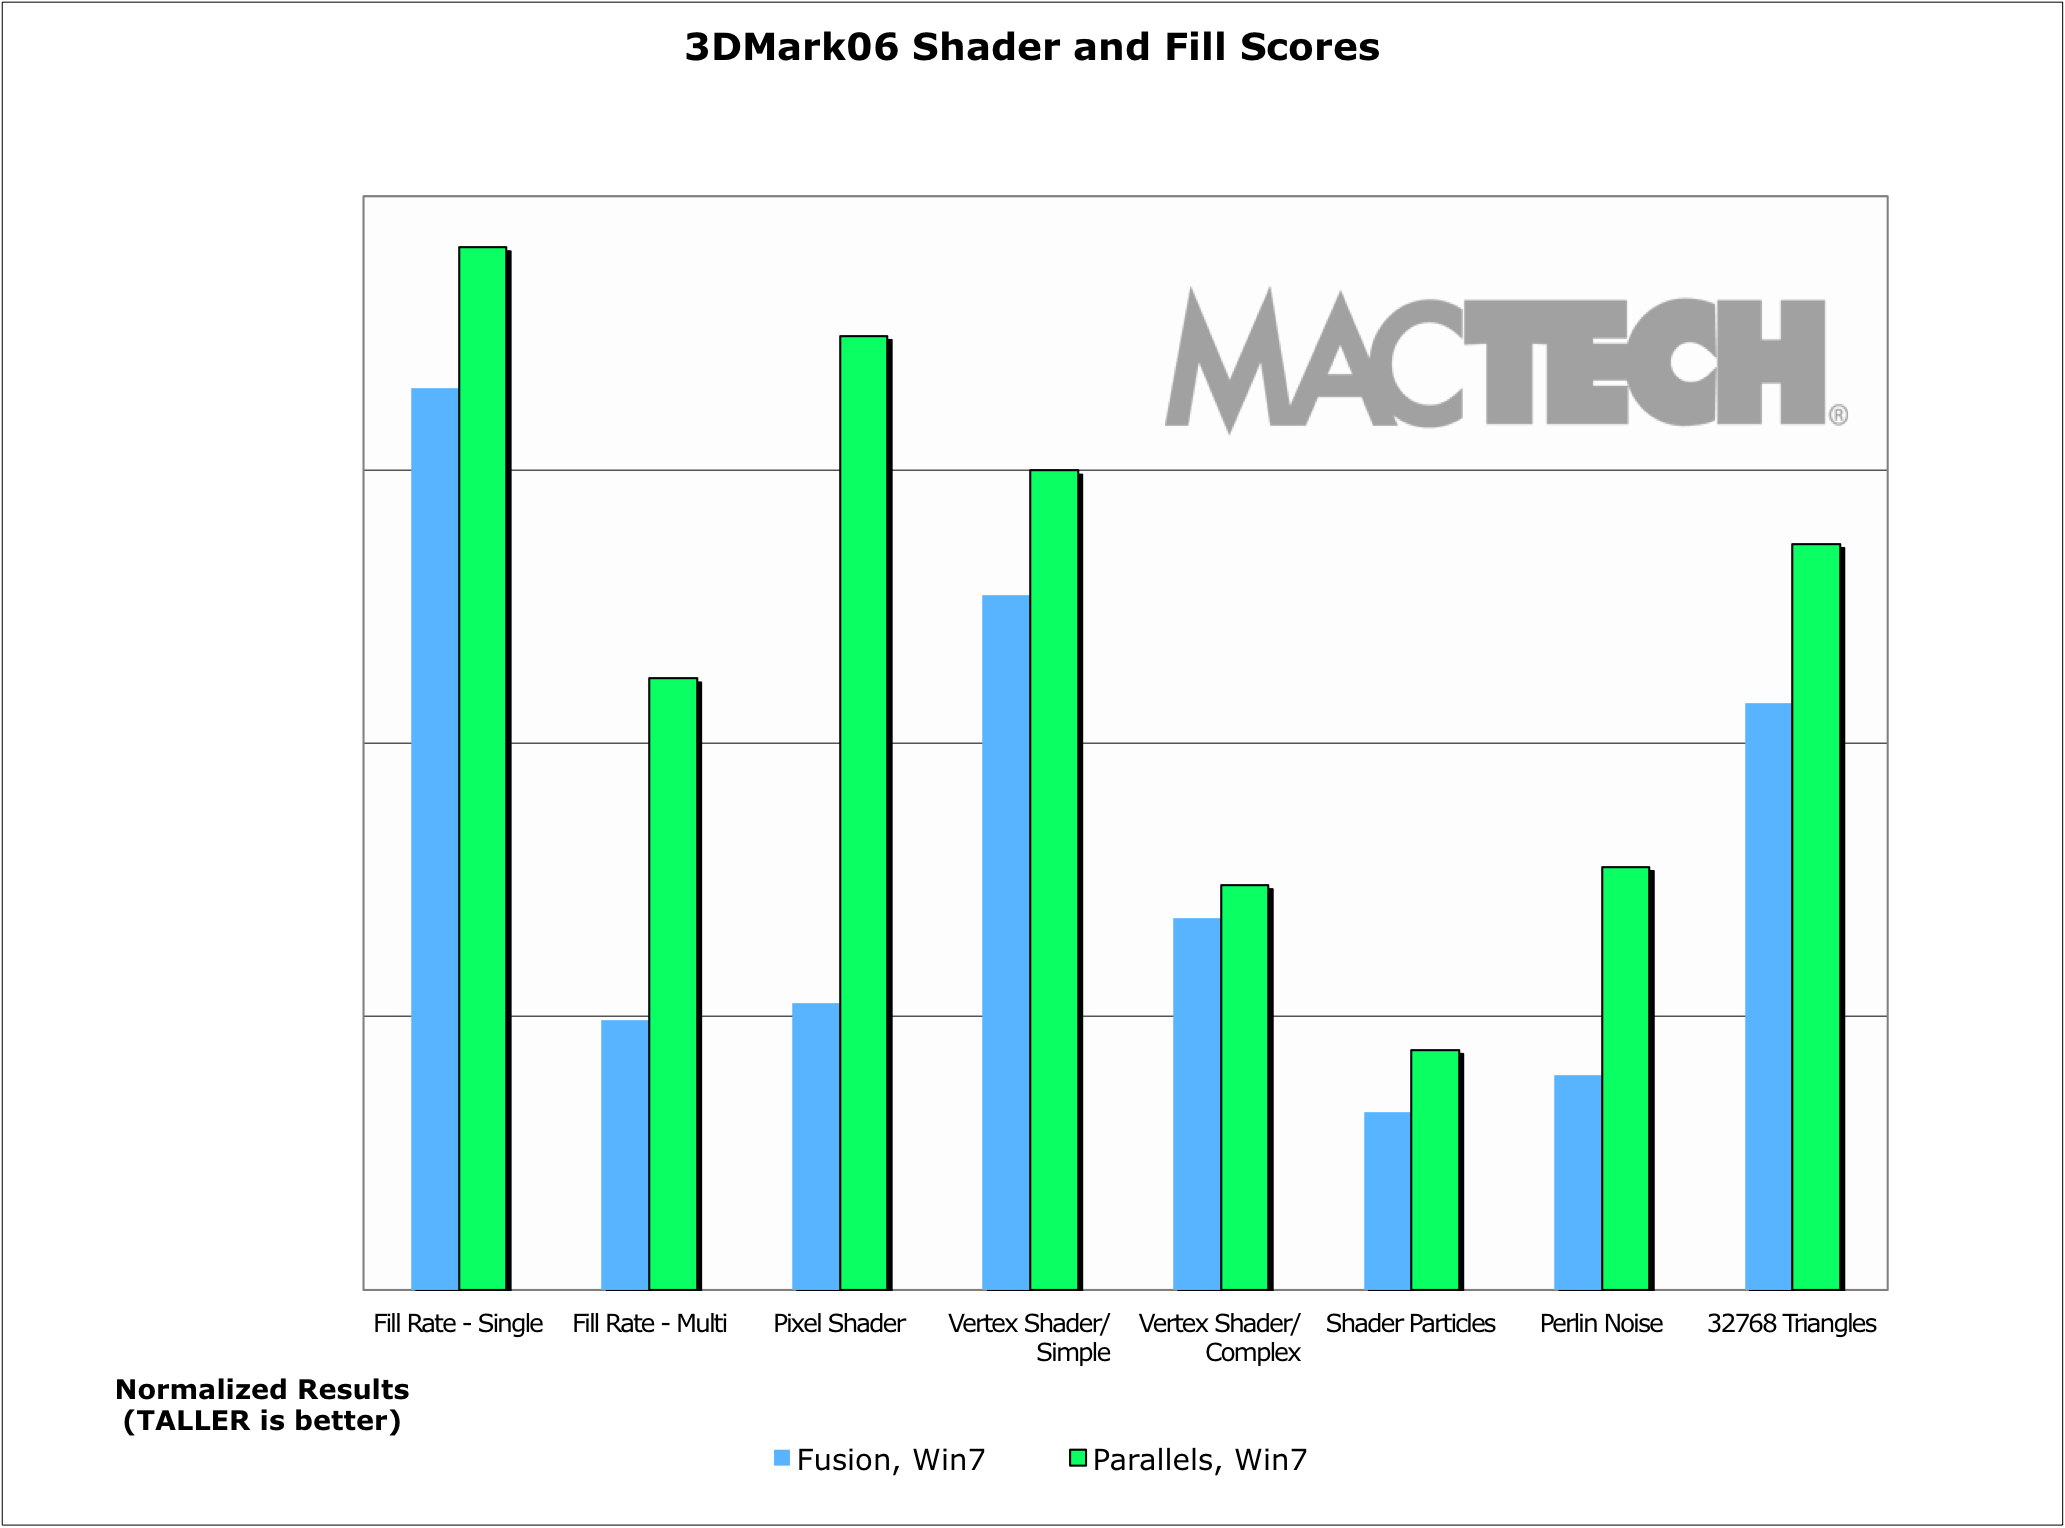
Shader and Fill Graphics Performance
Without a doubt, Parallels Desktop’s greatest advantage over VMware Fusion is in 3D graphics. Not only is the speed difference huge (Parallels Desktop is often double or more the speed of VMware Fusion), but everything just seems to run more smoothly.
Based on past experiences, we expected things to run well on the Mac Pro and MacBook Pro. We were very pleased to see how well all the Mac models run graphics and games—a noticeable difference from just a couple of years ago.
Obviously, the results for 3DMark06 vary greatly by the hardware they are on because of the graphics capabilities of each machine. As such, the best way to look at these is in the detailed spreadsheet where you can see results for each model for each OS.
Overall, these result charts will give you an idea of some of the things that VMware Fusion did well in. The overwhelming winner in this graphics competition is Parallels Desktop.
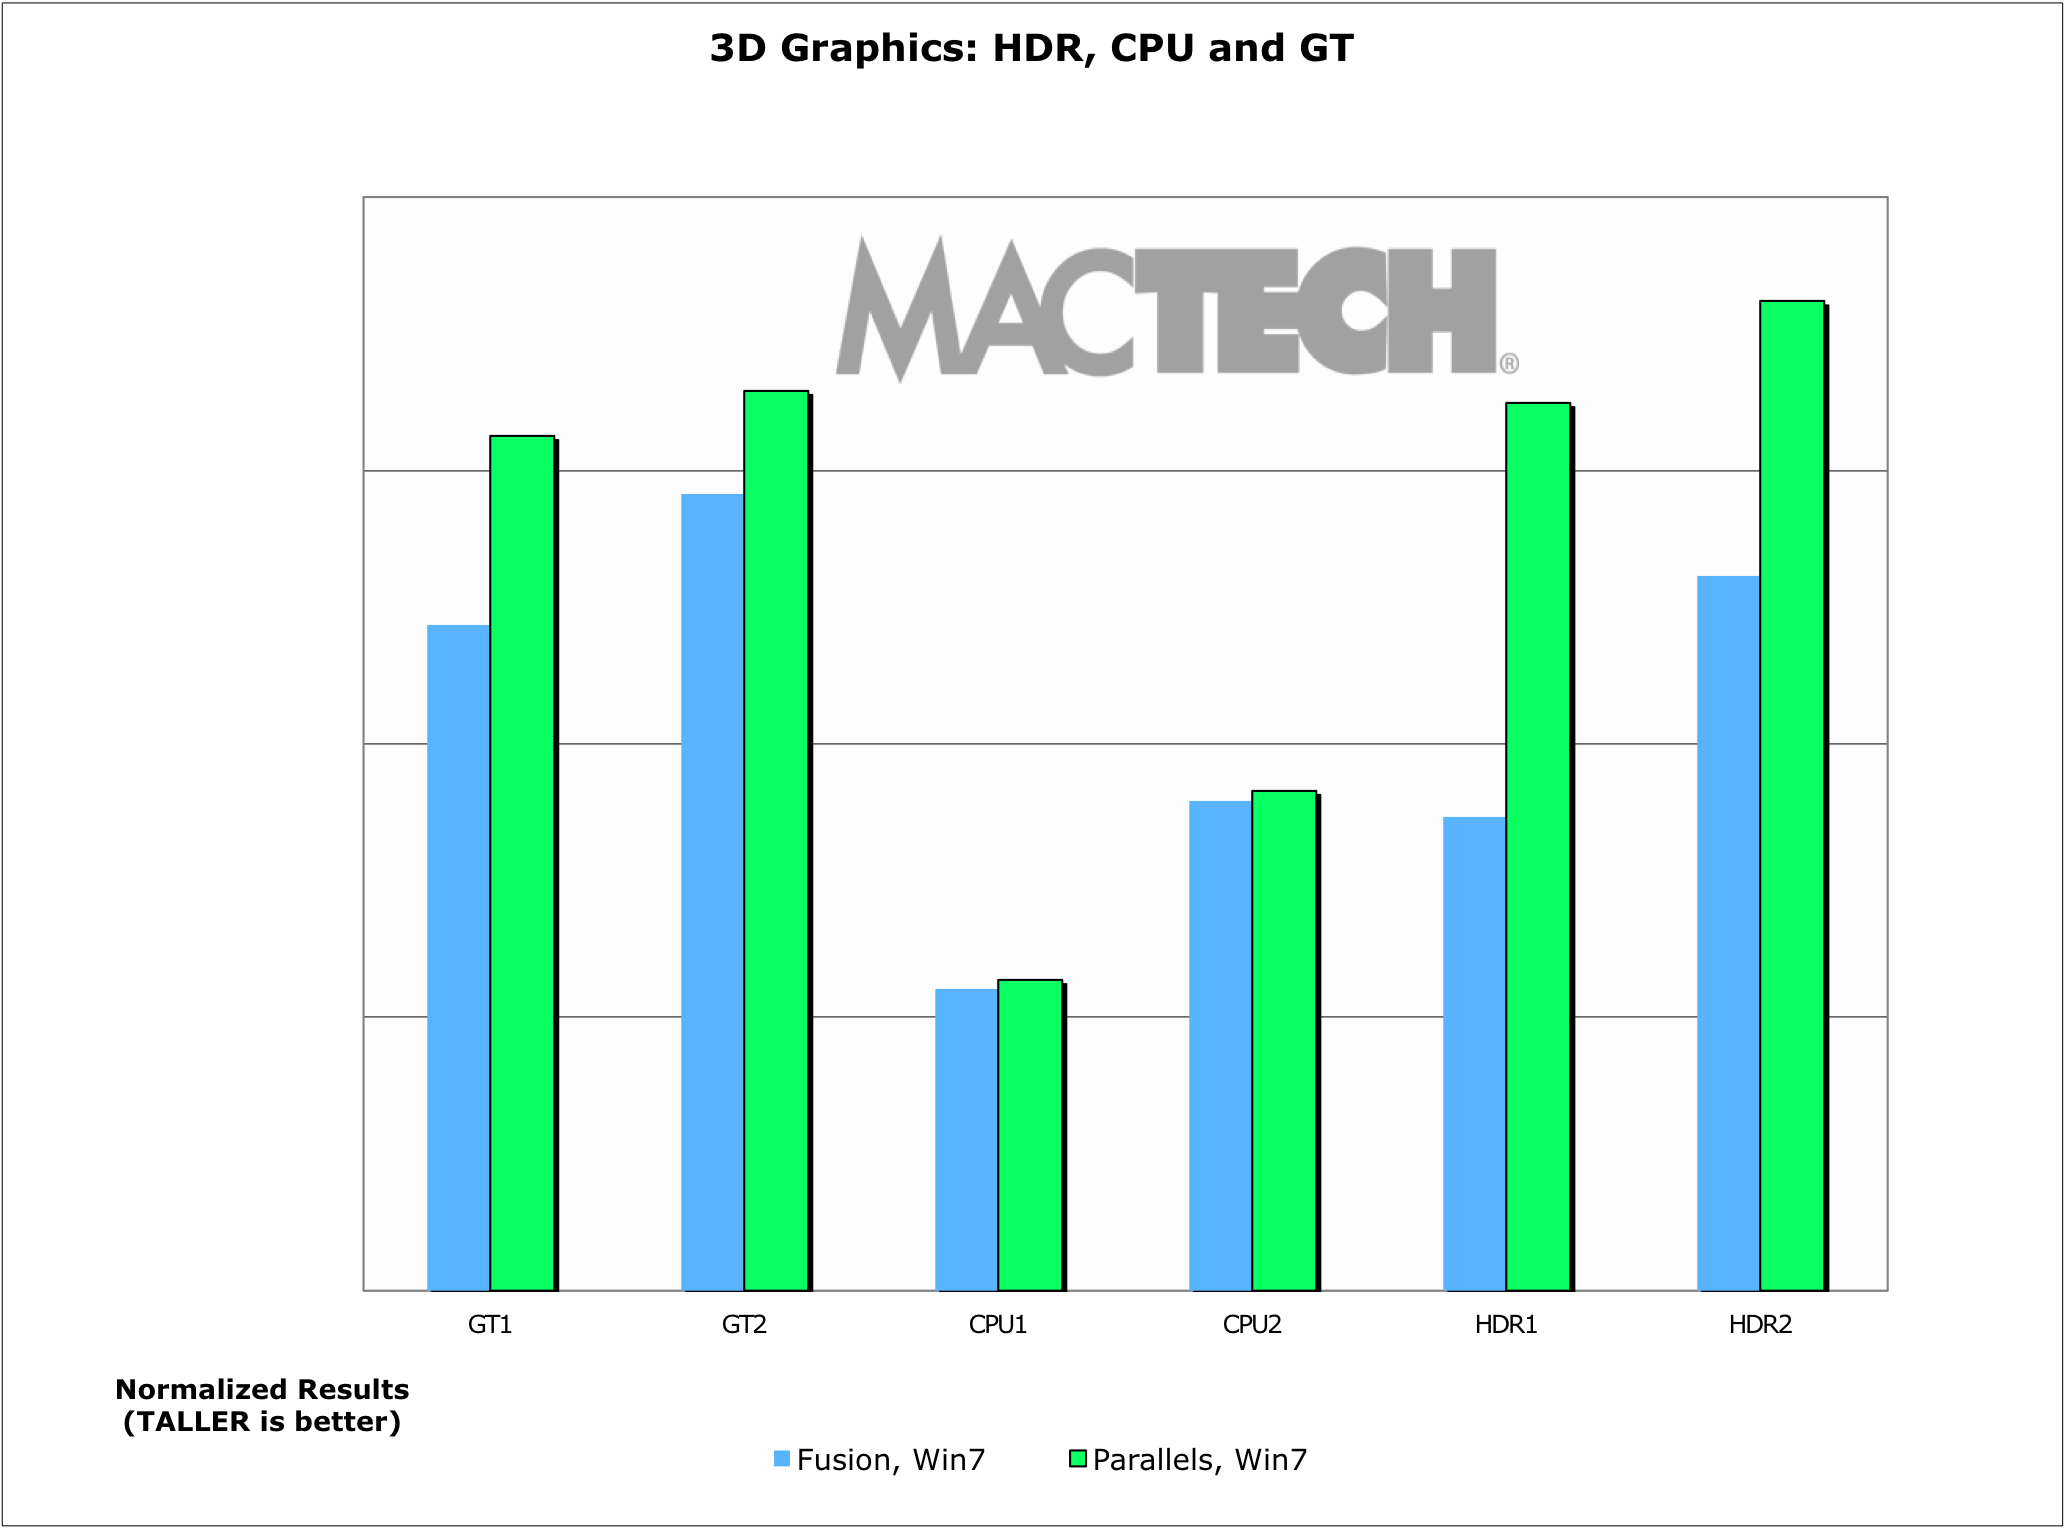
HDR, CPU and GT Tests 3DMark06 Suite
Additional Findings
There are additional tidbits that we learned through the incredibly complex process of testing virtualization products. Here are some additional insights.
64-bit and Virtual Processors
We chose 64-bit because it has become the standard on Windows to give users the additional addressability they would like. In our experimentations, however, we found the 64-bit default Windows 7 installation was about 2.5 GB larger than the 32-bit in hard disk space. Not a huge deal, but something to note.
These days, the decision is fairly simple. If you have an application that can make use of multiple virtual processors, and this includes 3D Graphics, and your Mac has enough horsepower, then you should use them. Otherwise, it’s not necessary.
Then again, if speed is that important to you, you should ask yourself whether to run the app natively on your Mac instead of in a virtual machine. But sometimes, like with some industry-specific software, you may not have an option.
Running Lion in Virtualization
Apple has finally changed their license with Mac OS X Lion so that users can run a virtual machine with Lion as the client OS. As a result, both Parallels Desktop and VMware Fusion tout that they can run Lion in a virtual machine. Of course, it was a moral imperative for us to check this out and see how it runs.
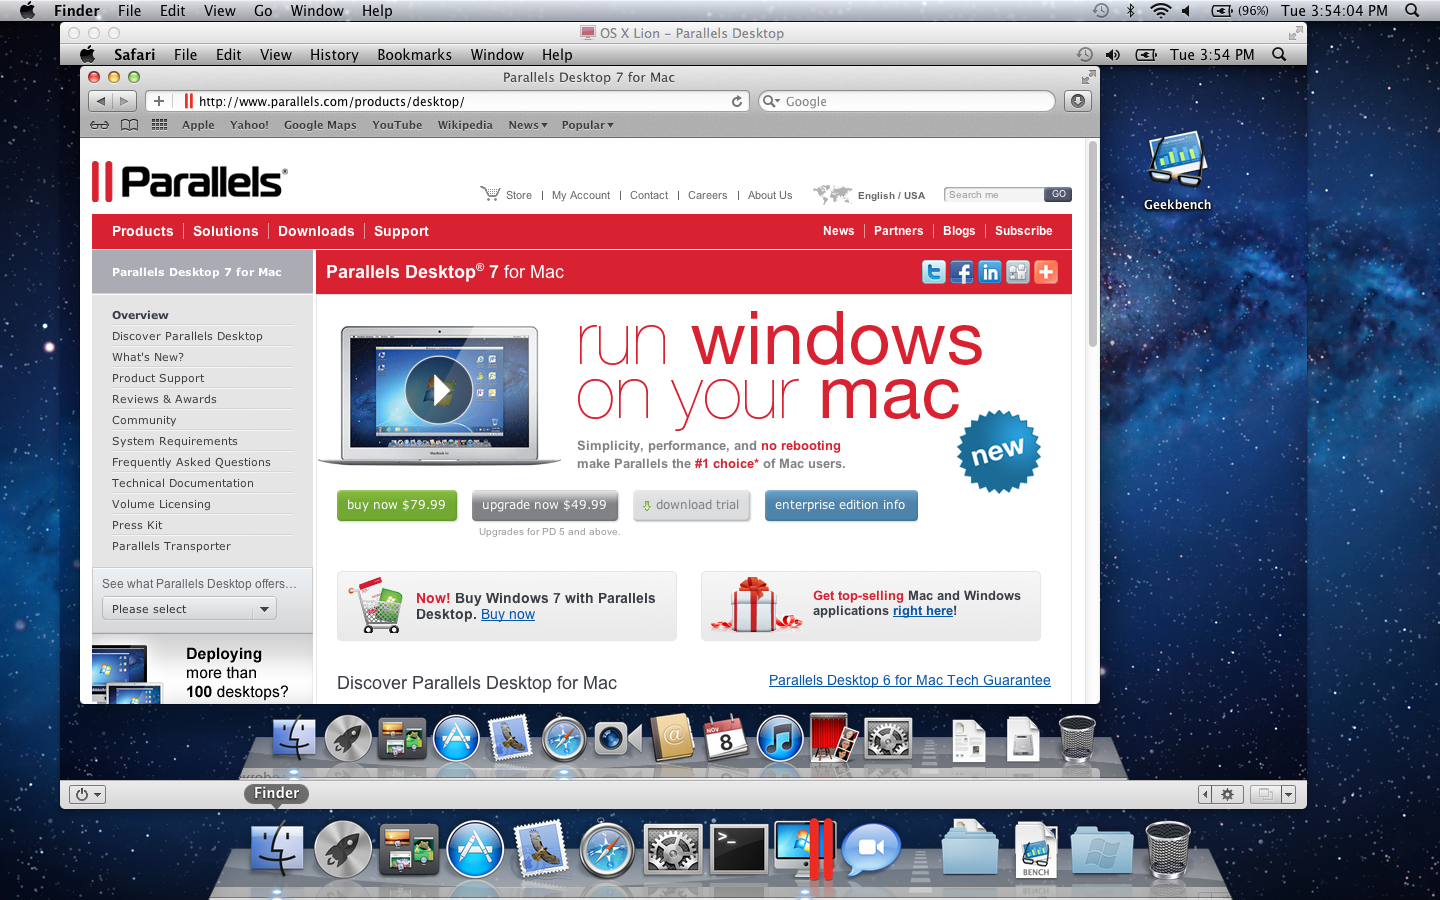
Parallels Desktop 7 Running Mac OS X Lion
In short, they run pretty well. Parallels booted Lion a bit faster, but we also wanted to see about virtual machine speed. Without doing comprehensive benchmarks, we took a quick run of Geekbench. In short, they ran comparably to each other. Clearly, neither company has optimized yet for Lion and I expect we’ll see improvements on this front.
VMware Fusion 4.0.2 Running OS X Lion
What would you use this for? One of the greatest uses may be for developers testing different builds of Lion and their product, and wanting to do so in a protected way. Beyond that, well, it’s a bit of a strange experience to say the least.
VCPUs and CPUs
The number of VCPUs can make all the difference in the world on the GeekBench performance results for the VMs. Most VMs are likely 1 VCPU, and to compare, we turned the Mac to use just one CPU. What we found is that a virtual machine with 1 VCPU actually performs better than the Mac does on its own with 1 CPU. Why? We believe it has to do with the host OS services behaving differently with 1 CPU including issues related to double CPU scheduling, background services, etc. The 1 VCPU is spread over multiple cores of the host OS’s processor.
What we did find is that while there is a difference between the 1 VCPU virtual machine compared to a Mac using a full i7 processor, the difference is quite reasonable. This is one place that we recommend looking at multiple VCPUs if you are going to do this on a regular basis.
Conclusion
Both VMware Fusion and Parallels Desktop for Mac are excellent products, and both allow you to run many OSes quite well (including Lion now). In the end, when you decide which product to use, you should take into account what’s most important to you.
Windows 7 is such a pleasurable experience that unless there’s some driving reason otherwise, you should use it rather than XP under either virtualization product.
When it comes to whether you should use multiple processors or 64-bit virtual machines, it depends on your use. If you have a real need for either, and can articulate a reason for it, than use them. They do work well. That said, if you don’t have a specific need, then don’t bother with multiple virtual CPUs. As for 64-bit, you should use it (especially in Windows 7) unless you have a driving reason not to.
Many people have the feeling of “more is better,” but when it comes to RAM in the virtual machine, that is not necessarily the case. More RAM means longer virtual machine launch times, suspends and resumes. For most users, 1 GB of virtual machine RAM will work best for Windows 7. Use more than that only if you really know you need it. Gaming may do best with 1.25-1.5 GB of RAM if you can spare it.
In the vast majority of overall our tests, Parallels Desktop 7 won. Again, if you count up the general tests (including the top 3D graphics scores), Parallels won 60% of the tests by 10% or more. And, if you include all the tests where Parallels was at least 5% faster, as well as the balance of the 3DMark06 graphics tests, Parallels increased the lead further. In other words, Parallels Desktop 7 beat VMware Fusion 4.0.2 in 74.9% of the general tests we ran, and Parallels was double the speed or more in almost a quarter of the top-level tests.
If you focus exclusively on 3D graphics, as measured by 3DMark06 version 1.2, Parallels won by an even larger margin. Specifically, Parallels won 71% of the tests by 10% or more, and was also a bit faster on an additional 8% more of the tests, and tied on the rest. In other words, Parallels Desktop 7 beat or tied VMware Fusion 4.0.2 in all of the 3D graphics tests we ran.
If you are a traveler, Parallels Desktop has new power management features that stretch your battery life. On the MacBook Pro, we saw about 25% more battery time on an idling virtual machine (81 additional minutes of use) than we did on VMware Fusion in the same test.
To be clear, this article is not a product review; it’s a benchmarking analysis. You should use it as part of your decision combined with other factors, such as product features, user interface, which OS you want to run, graphics capabilities and support to make your product choice.
One thing is clear: virtualization for the Mac works well. Really well. And I expect that we’ll see virtualization products keep getting better and better.
Appendix A: Benchmarking Methodology
Introduction
The purpose of this appendix is to outline the basic parameters for how MacTech Magazine performed benchmarking tests on VMware Fusion, and Parallels Desktop for the purpose of evaluating the performance of virtual machines running Windows 7.
Consistency
Since the tests involve both multiple machines and multiple pieces of software, the focus was on creating as much consistency across the tests as possible. MacTech accomplished this in several ways.
First, each set of tests was performed by a single MacTech staff member to eliminate any of the natural inconsistencies that often occur across individuals.
All of the tests were performed on the same version of the Mac operating system across the different hardware. At the time of the tests, this was OS X 10.7.1 and included the most up-to-date versions of Apple patches as prescribed through “Software Update” in OS X.
All of the tests were done on “virgin” systems, i.e., freshly wiped hard disks, with fresh Mac OS X, virtualization application, Windows and Microsoft Office installations, with no third party software installed beyond the standard Mac OS X. Only one virtualization application was installed to avoid any possible interactions. Furthermore, care was taken to make sure the virtual hard drives were located in a similar position on the hard drive.
All of the tests were performed with the most up to date set of patches for Microsoft Windows and Office as prescribed by Microsoft’s automatic updates, including service packs, optional and recommended updates.
Avoiding Interactions
While the tests covered a variety of applications, all tests (where appropriate) were performed with only that single application open. In other words, to the extent possible, no other applications will be running. (Obviously excluding background and OS tasks that are part of a standard install of either OSes or Microsoft Office.)
To avoid issues with a noisy network, the test machines were installed on what was considered a “quiet” network with minimal traffic. MacTech monitored the use of the network to make sure that the machine does have network access, but is not impacted by the network.
Measurements, Testing and Outliers
For timed tests with results under 60 seconds, tests were measured to within 1/100th of a second. For those over 60 seconds, tests were measured to within a second.
Most tests were performed at least three times per test and per machine configuration, and often 5+ times depending on the test. Outliers indicating a testing anomaly were retested as appropriate.
In most cases, the tester used successive tests, not “Adam” or “first” tests to better emulate typical daily use.
Those tests that could be impacted by the size of the window were tested with the same window size, and screen resolution under all scenarios.
Some tests were eliminated because the machines simply performed too fast to get an accurate measurement. For example, sending or sorting emails always performed faster on the machine than the tester could measure.
Appendix B: Testing Results
In keeping the results fully open, MacTech is making the test data available in the form of an Excel spreadsheet. Simply drop us an email and we’ll be happy to provide it to you.
About the Author:
Neil is the Editor-in-Chief and Publisher of MacTech Magazine. Neil has been in the Mac industry since 1985, has developed software, written documentation, and been heading up the magazine since 1992. When Neil does a benchmark article, he likes to test the features that people will use in real-life scenario and then write about that experience from the user point of view. Drop him a line at publisher@www.mactech.com.
![[MD1] HyperCard 2.3.5 update](https://www.mactech.com/wp-content/themes/Extra/images/post-format-thumb-text.svg)