Last year, Flurry (http://www.flurry.com) — which offers a mobile application analytics and recommendation-engine driven advertising platform — reported that iPhone and iPod touch game sales surged from 2008 to 2009. From a standing start, and in just one year, iPhone games captured 5% of the mature U.S. video game market.
A year later, Flurry revisited how the increasing popularity of iOS (iPhone, iPod touch and iPad) and Android games continue to increase their U.S. video game market share. With an additional year of trend data, the magnitude of disruption is increasing, in particular within the portable gaming category.
For this year’s report, Flurry once again leveraged publicly available market data in the news, released by companies such as the NPD Group (e.g., Gamasutra’s Behind the Numbers series). Flurry combined this data with their own estimates of game category revenues from iOS and Android devices. Flurry Analytics, the company’s mobile application analytics service, tracks more than 12 billion anonymous, aggregated use sessions per month across more than 80,000 applications. Of this, nearly 40% of all consumer app sessions are spent on games.
For 2010, Flurry expanded their iPhone and iPod touch numbers to include revenue delivered by tablets and Android devices. When running this analysis a year ago, the iPad hadn’t been launched and Android gaming revenue from 2008 and 2009 hadn’t yet contributed enough revenue to meaningfully affect industry market share. For the sake of a consistent year-over-year comparison in all other aspects of this analysis, Flurry continued to exclude retail computer game revenue, and once again didn’t include online digital game sales.
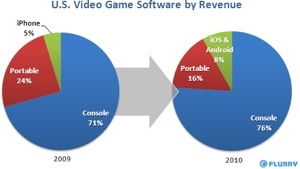
From 2009 to 2010, iOS and Android game sales increased from 5% to 8% market share within the U.S. video game market. Specifically, Flurry estimates that iOS and Android game revenue increased from $500 million in 2009 to more $800 million in 2010. Of this, the significant majority of revenue was generated by iPhone games.
And while Flurry didn’t include retail computer game revenue in their total snapshot, which they estimate was US$700 million in 2010, it’s worth noting that smartphone and tablet game revenue surpassed the U.S. PC game category for the first time in 2010.
From 2009 to 2010, iOS and Android game sales have spiked significantly, resulting in nearly a doubling of their market share, says Flurry. With both Nintendo DS and Sony PlayStation Portable shrinking in sales, while smart-device game sales simultaneously grew by more than 60%, iOS and Android games now represent more than one-third of the portable game category.
“It’s clear that prolific installed base gains by Apple and Android devices, low priced games (including a very robust free-to-play model enabled by in-app purchases) and seamless digital distribution to games on devices so near to consumers 24-hours-a-day, is driving potent industry-disruption,” says Flurry. “Over 2011, we expect to see continued and significant smart-device game growth fueled by the recent launch of iPad 2, iPhone coming into distribution on Verizon, the expected release of iPhone 5, a relentless expansion of Android devices by leading OEMs across all major U.S. carriers, and Google’s enablement of in-app purchase billing, a proven key driver in iOS game revenue.”