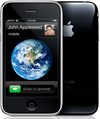
Overall satisfaction among smartphone and traditional handset owners whose phones are equipped with touch screens is considerably higher than satisfaction of owners of phones that have other input mechanisms, according to a new report by J.D. Power and Associates (http://www.JDPower.com). And the iPhone leads the pack in customer satisfaction.
Among smartphone owners whose device has a touch screen, satisfaction averages 771 on a 1,000-point scale, nearly 40 index points higher than among those whose smartphone uses other input methods, such as a text keyboard. Currently, slightly more than one-half of owners indicate their smartphone has a touch screen for navigation. While not as readily available on traditional mobile phones, satisfaction on phones with a touch screen averages 756-53 index points higher than the industry average.
“Touch screens are ideal for those using their phone for entertainment, as the displays are generally larger and provide a richer viewing experience,” says Kirk Parsons, senior director of wireless services at J.D. Power and Associates. “It is critical, however, that manufacturers meet expectations with regard to providing adequate battery life, as these large displays can drain batteries very quickly. In addition, for customers to have a truly rewarding experience, wireless carriers must continue to provide problem-free, high-speed downloads, as customers rely on them to deliver content quickly and on the go.”
These two studies measure customer satisfaction with traditional wireless handsets and smartphones across several key factors. In order of importance, the key factors of overall satisfaction with traditional wireless handsets are: operation (30%); physical design (30%); features (20%); and battery function (20%). For smartphones, the key factors are: ease of operation (26%); operating system (24%); physical design (23%); features (19%); and battery function (8%).
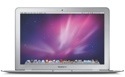
Apple ranks highest in customer satisfaction among manufacturers of smartphones with a score of 810, and performs particularly well in ease of operation, operating system, features and physical design. RIM BlackBerry (741) follows Apple in the rankings.
LG ranks highest in overall wireless customer satisfaction with traditional handsets with a score of 729, and performs well in all five factors, particularly physical design, features and operation. Sanyo (712) and Samsung (703) follow LG in the rankings.
The study finds that both smartphone and traditional handset owners are increasingly using their phones for entertainment and sharing media with friends, family and members of their social network. Among traditional handset owners, 25% indicate they frequently send and receive multimedia and picture messages, an increase of 25% from just six months ago. Smartphone users are nearly twice as likely to share multimedia messages. In addition, nearly one-fifth (17%) of smartphone owners with touch screen-equipped handsets indicate they frequently download and watch video content on their device, which is significantly higher than the segment average.
The studies also find the following key wireless handset usage patterns:
° Global Positioning System (GPS) capabilities are a desired feature among both traditional mobile phone and smartphone users. More than one-third (35%) of traditional mobile phone owners say they want GPS features on their next handset purchase, while 15% of smartphone owners say they want GPS.
° Younger users continue to be more satisfied with their handset regardless of whether it’s a traditional mobile phone or a smartphone. Satisfaction among traditional mobile phone users 18 years old to 24 years old is 35 index points higher than the segment average, while satisfaction among smartphone users within the same age range is 18 index points above the segment average.
° Mobile applications continue to enhance the smartphone user experience. Sixty percent say they download third-party games for entertainment, while 46 percent say they download travel software, such as maps and weather applications. Thirty-one percent say they download utility applications, while 26 percent say they download business-specific programs, indicating that smartphone owners are continuing to integrate their device usage into both their business and personal lives.