

Games: F1 Race Stars and Choices
Contents
Virtualization Benchmarks
By Neil Ticktin, Editor-in-Chief/Publisher
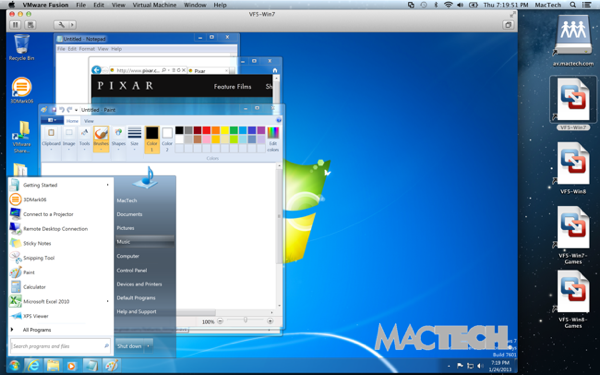
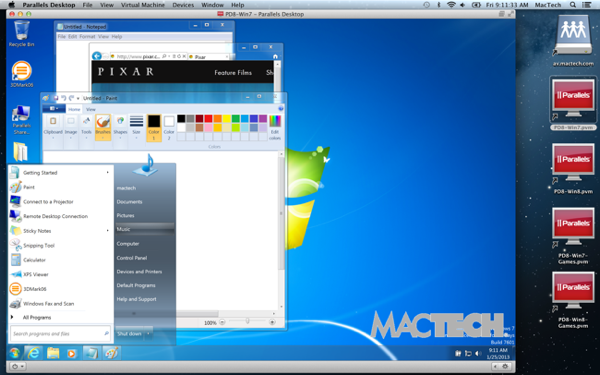
Head-to-Head: How do VMware Fusion 5 and Parallels Desktop 8 for Mac compare?
Why Virtualization?
In 2005, Apple announced the switch of the Mac platform from PowerPC to Intel processors (the first Intel-based models were available in early 2006). This introduced some interesting opportunities for the Mac, including the ability to run operating systems other than Mac OS X on a Mac. This includes not only your everyday Windows 7 or 8, but also other 64-bit OSes including Linux and more.
You may already understand your options for running Windows on a Mac, but in case you don’t, your first choice is to decide between Apple’s Boot Camp, and a virtualization product like VMware Fusion or Parallels Desktop for Mac. With Apple’s Boot Camp, you can run Windows 7 natively, but you have to reboot every time you want to switch between OS X and Windows. In addition, you can only use one OS at a time, it’s designed for Windows not Linux, and it doesn’t have support for Windows 8 or even XP. Despite a speed advantage for some things, that’s not particularly convenient. For that reason, MacTech recommends a virtualization product for most users.
In addition, virtualization gives "switchers" (those switching from Windows to Mac) more comfort because they can use their old applications and more easily get to their old data. It gives all Mac users the ability to use some critical piece of software not available on the Mac. For example, your job may require you to run Internet Explorer, the Windows version of Outlook, or some other possibly vertical market software that your corporate systems support. Or, you may simply want to play a Windows game not available on the Mac.
With virtualization, like you’ll see in Parallels Desktop for Mac or in VMware Fusion, you can run Windows alongside OS X, getting the best of both worlds. For many, this may mean running Windows in a “window” on your Mac. Both VMware Fusion and Parallels Desktop also have the ability to run Windows applications even more transparently or full screen, but we’ll leave that for another discussion.
Your final option is to use Parallels Desktop for Mac or VMware Fusion to access/use your Boot Camp volume rather than a virtual hard disk. This gives you the option of sometimes booting Windows natively, and other times, using the volume for virtualization. As the performance of doing this has improved so much, this has become a viable option for users.
The Big Question
So which virtualization product do you go with? Which solution is faster? Should you run Windows 7 or 8? One virtual processor or more? Can you run OS X in a virtual machine? In short, there are different answers for different people; it all depends on your needs. More and more, virtualization can accommodate whatever your needs might be.
To tackle this problem, MacTech has once again undertaken a huge benchmarking project. We often wait, as we did this year as well, for a patch or two after major upgrades to give time for major new versions to shake out because it often has impact on the testing. This is similar to the virtualization benchmarking projects that MacTech undertook in past. In both cases, as with other MacTech benchmarks, we tested performance of the types of things that everyday users typically do. In this case, it was not just testing the raw performance of the Windows OS, but also commonly used Windows applications. Like last time, based on reader feedback, we paid attention to 3D graphics and gaming. We also looked at how well the products performed supporting the new Retina screens.
The goal was to see how VMware Fusion and Parallels Desktop performed, under Windows 7 and Windows 8. Furthermore, we wanted to see some of the differences with different Mac models with different graphics and processor types.
To be clear, this article is not a product review; it’s a benchmarking analysis. The article’s purpose is to assess performance (including issues we found if something didn’t work as expected), and not product features, user interface, etc. You should use your assessment of features, user interface, and support in conjunction with this article’s benchmarking results to make your product choice.
Before you ask why other solutions and products were not included, let’s answer that. This benchmark project is already huge with thousands of collected data points crossing four guest OSes (Windows 7, Windows 8, OS X Lion, and OS X Mountain Lion), five models of computers with mechanical hard drives and SSDs, and over 60 tests each run 3-5 times for most of the environments. There were several thousand tests to be completed, many with a stopwatch. That’s all before a single word of this article is written!
To add even one product would increase this huge test matrix by 50%. As a result, we focused on the two leading commercial virtualization products that come with support. These two products also have free trial versions that you can compare against other solutions (i.e., try before you buy).
One thing to note, however, is that open source and other free products may not be for everyone, especially non-technical users. For many, these offerings can be difficult to understand and install, and they do not have technical or product support behind them. Obviously, users can reach out in forums and the community, but if you don’t understand something, you won’t be able to pick up the phone and call support the way you can with a commercial product. If that works for you, great! If not, as is the case for most users, then a commercial product is likely your solution.
When we were choosing computer models, we chose the current model of Macs that give a good representation of what most people may have. Certainly, the faster models of these computers will perform even better.
We chose five Mac models to compare alongside each other: MacBook Air, MacBook Pro, a tricked out MacBook Pro Retina, iMac (late 2011), and Mac Pro. Given the RAM requirements of Windows 7, the minimum configuration tested (including on the MacBook) was 4 GB.
8 GB MacBook Air 13-inch, 1.8 GHz dual-core Intel Core i5 processor
Specifically: 8 GB/256 GB, Intel HD Graphics 4000
4 GB MacBook Pro 15.4-inch, 2.3GHz quad-core Intel Core i7 processor
Specifically: 4GB 1600MHz memory/500 GB 5400-rpm
Intel HD Graphics 4000 and NVIDIA GeForce GT 650M with 512MB of GDDR5 memory
16 GB MacBook Pro with Retina 15-inch, 2.7GHz quad-core Intel Core i7 processor
Specifically: 16GB 1600MHz DDR3L SDRAM/768GB Flash Storage
Intel HD Graphics 4000 and NVIDIA GeForce GT 650M with 1GB of GDDR5 memory
4 GB iMac 27″, 2.7GHz Quad-Core Intel Core i5 processor
Specifically: 4 GB/1 TB 7200-rpm
AMD Radeon HD 6770M with 512MB
6 GB Mac Pro, One 3.2GHz Quad-Core Intel Xeon processor processors
Specifically: 6 GB/1 TB 7200-rpm / ATI Radeon HD 5770 with 1GB GDDR5
Memory for virtual machines can be configured with a wide array of settings. As a rule, both VMware Fusion’s and Parallels Desktop’s default memory for each configuration (of physical RAM and “guest” OS) were the same, and we made sure that was the case. Windows 7 and 8 virtual machines ran with 1 GB of virtual machine RAM (except for gaming). Lion and Mountain Lion (OS X) ran with 2 GB of virtual machine RAM. For gaming, we used 1.5 GB for 4 GB hardware, and 2 GB on hardware with 6 GB or more.
Similarly, for disk allocation we set up all of the virtual machines similarly. We used default sized (64 GB on Parallels, and 60 GB on VMware) expanding disks in a single file (e.g., not 2 GB chunks), but the disks were pre-expanded so that expanding actions wouldn’t affect results. The disk location of the virtual hard drive was in a similar physical location between computers, as that can make a significant difference in disk performance.
The tests compared VMware Fusion 5.0.2 with Parallels Desktop for Mac 8.0.18314.813278, running on Mac OS X 10.8.2 with all updates. All “important,” but not “optional,” Windows updates also installed for Windows 7 and 8. By the time we got to testing games, we saw new versions released that could have impact, and therefore (games only) were tested on VMware Fusion 5.0.2 with Parallels Desktop for Mac 8.0.18354.823166, including additional updates to OS X 10.8.2.
Test Types
There are a variety of often referred to, and utilized benchmarking suites in the computer industry including SPEC tests, PCMark, WorldBench, Performance Test, Unixbench and others. Each of these tests uses a series of tests that measure in a consistent way to assess specific types of performances. The key to each of these tests is appropriateness, repeatability, and accuracy.
We are sometimes asked how we select the tests we have in benchmarks. The goal is to represent the types of actions that virtualization users are doing on a regular basis. In particular, we focus more on user tasks rather than installation or configuration (because they are typically only done once or infrequently).
In the PC market, PC World (magazine) uses WorldBench as their benchmarking tool of choice. If you don’t know about WorldBench, you can see more at http://www.worldbench.com. WorldBench 7 uses a combination of applications bundled together to determine benchmarks. This may be a very good way for PC World to approach things, but obviously it’s not reflecting the virtualization part of the experience or weighing towards the typical types of things people do in virtualization on the Mac.
There are a variety of other benchmarks available, and we’ve looked at many of them as possible tools to include in our mix. Often, we find their measurements simply don’t reflect a true user experience. Other times, they don’t reflect how a virtualization user may be using Windows, or even they simply report erroneous results. For example, in previous attempts to use PassMark, we found their graphics scores were not at all representative of real life graphics performance in games or other graphic uses. Those tests showed items as faster when, in fact, they were much slower. Benchmarks are only useful if they reflect the real world.
Rather than use WorldBench or others, we focus on the types of measurements we believe best represent the experience we see (in terms of speed). And while it takes practice and some skill, we test virtualization operations with a stopwatch—as the closest representation of how a real user would see it. CPU crunching ability, for example, is measured through tests like zip’ing files directly in Windows. For Office users, we use the most up to date version of Microsoft Office for Windows (2010), again with updates.
There are two exceptions to this: graphics/gaming and CPU utilization. In these two cases, we found that testing utilities not only work well, but also are necessary to give the most repeatable and concrete results. In the case of graphics benchmarking, we used 3DMark06 (the industry standard for tuning gaming systems). For game playing performance, we used FRAPS to measure frames per second. Finally, for CPU utilization we used “top” combined with Apple Remote Desktop.
Remember, benchmarks are not a review: they are benchmarks. They are simply meant to just tell you which runs faster. If you are interested in a specific feature, support, the user interface, or any of the other criteria for deciding on a product, that’s a different article.
We won’t keep you in suspense. When we look at the “big picture” of all the top-level test results, Parallels is, once again, the clear winner. Let’s look at this in three groups of tests.
If you look at all the tests, including the 3DMark06 detailed tests, Parallels won over 68% by 5% or more, 56.9% of the tests by 10% or more, and 31.7% by 25% or more. VMware Fusion won 7% of these tests by 5% or more, 3.7% by 10% or more, and 0.2% by 25% or more. In 24% of the tests, the two products were within 5% of each other (i.e., they tied).
In our general and top level tests, which gives a good variety of challenges including top level 3D Graphics tests (but drops the detailed graphics tests), Parallels won over 68% by 5% or more, 55% of the tests by 10% or more, 27% by 25% or more. VMware won 7% of these tests by 5% or more, 4.5% by 10% or more, and 0.3% by 25% or more. Just over 24% were a tie.
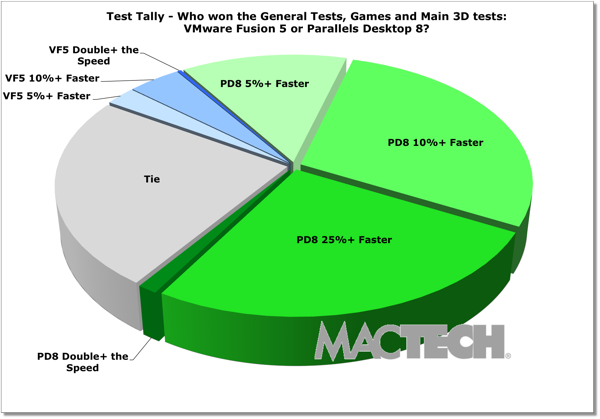
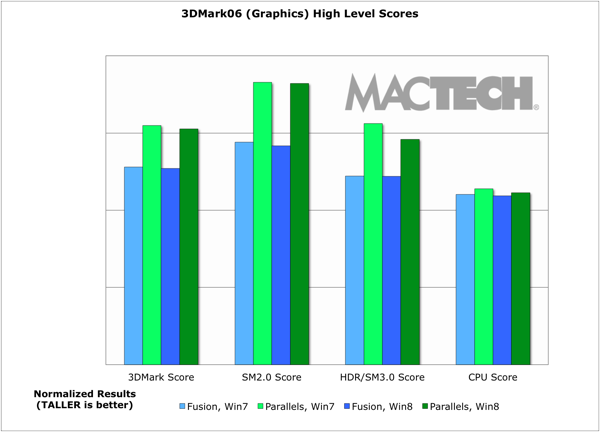
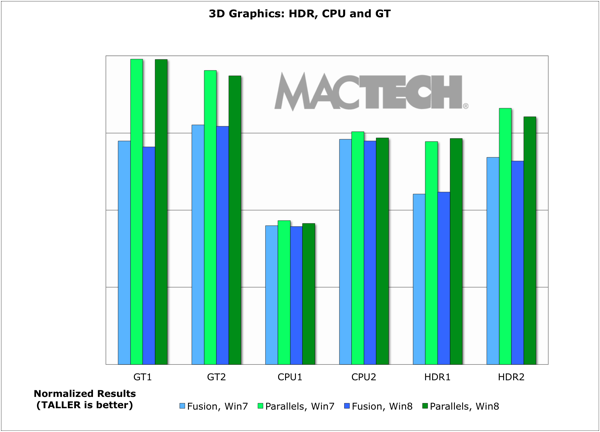
If you focus exclusively on 3D graphics, as measured by 3DMark06, Parallels won by an even larger margin. Specifically, Parallels won 62.6% of the tests by 10% or more, and was also a bit faster (at least 5%) on an additional 8.9% more of the tests, and tied on the rest. VMware Fusion 5.0.2 was faster than Parallels in 4.4% of the 3D graphics tests we ran.
3DMark06 has three main aggregate scores. The most important of which is the “3DMark Score.” In addition, SM2.0 Score measures 3D Shader Model 2.0 performance, and the HDR/SM3.0 Score measures the 3D Shader Model 3.0 & HDR performance.
There are a handful of places where VMware Fusion consistently was faster than Parallels Desktop. For example, successive launches of Microsoft Word were faster (usually by about a quarter of a second). Also, when running OS X as a guest, VMware was consistently faster on shut down of the guest.
Parallels Desktop has power management features that stretch your battery life. On the MacBook Pro, we saw about 40% more battery time on an idling virtual machine with Internet Explorer open (which results in about two hours of additional use) than we did on VMware Fusion in the same test in Windows 7. Parallels ran Windows 8 about 40 minutes longer as well before running out of juice.
One of the best ways to visualize the huge amount of data points is through MacTech‘s well-known “Colored Cell Worksheet Overview.” In these worksheets, a cell represents the best result for each test for each version of Windows for each virtualization product. These are then colored according to which product was faster.
Green cell coloring means Parallels Desktop was faster than VMware Fusion. A blue cell coloring indicates VMware Fusion was faster than Parallels Desktop. Scores that were within 5% of one another are considered a tie. Coloring darkness has four thresholds: >5%, >10%, >25% and double the speed or more. (Note: Not all tests were run on all configurations, hence the empty cells.)
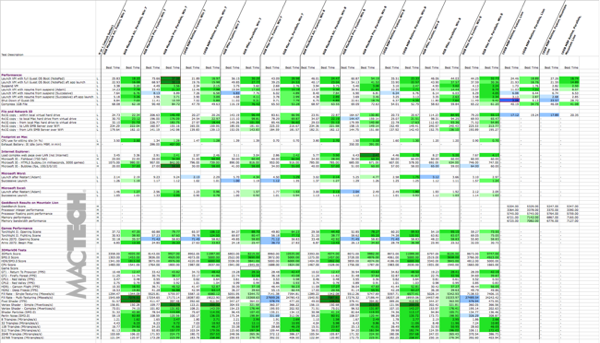
Obviously, when you look at the amount of green on the worksheet, you can see that Parallels was faster in the vast majority of tests that we ran. That said, VMware has made improvements in overall speed since the last time we looked at these two products.
The Test Suite and Results
In the sections below, we’ll walk you through what we tested, and the results for each. These tests are designed to arm you with the information so you can make the best decision for your type of use.
For each set of results, you can see the analysis for each model of computer running Windows 7 and 8. If you want to see more detail on the tests or on an individual Mac model, you may want to review the spreadsheet for those details.
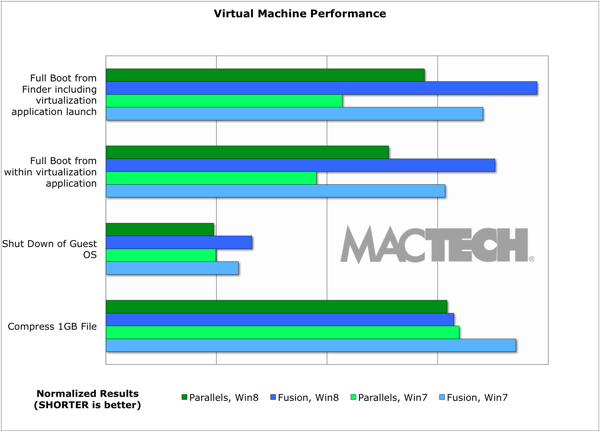
As you look through the charts below, pay attention to whether the better result is represented by taller or shorter bars. For vertical bars, taller is better. For horizontal bars, shorter is better. See the lower left corner of each chart as a reminder.
For the launch tests (launching the VM, Booting Windows, and Suspend/Resume), we had the option of an "Adam" test and a "Successive" test. Adam tests are when the computer has been completely restarted (hence avoiding both host and guest OS caching). Successive tests are repeated tests without restarting the machine in between tests, and can benefit from caching. Both can mimic real use situations depending on a user’s work habits.
The tests used were selected specifically to give a real-world view of what VMware Fusion and Parallels Desktop are like for many users. We didn’t focus on the tests that were so short in time frame (e.g., fast) that we could not create statistically significant results, or that had unperceivable differences.
For some of the analysis, we "normalized" results by dividing the result by the fastest result for that test across all the machine configurations. We did this specifically so that we could make comparisons across different groups, and to be able to give you overview results combining a series of types of tests, and computer models.
Instead of a plain "average" or "mean", overall conclusions are done using a "geomean", which is a specific type of average that focuses on the central results and minimizes outliers. Geomean is the same averaging methodology used by SPEC tests, PCMark, Unixbench, and others, and it helps prevent against minor result skewing. (If you are interested in how it differs from a mean, instead of adding the set of numbers and then dividing the sum by the count of numbers in the set, n, the numbers are multiplied and then the nth root of the resulting product is taken).
For those interested in the benchmarking methodologies, see the more detailed testing information in Appendix A. For the detailed results of the tests used for the analysis, see Appendix B. Both appendices are available on the MacTech web site.
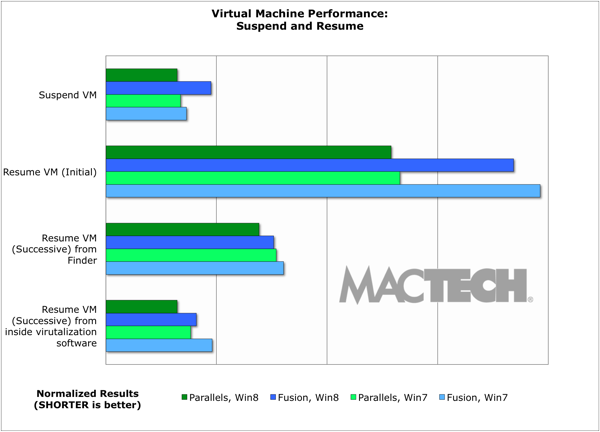
There are three situations in which users commonly launch a virtual machine:
Launch the virtual machine from "off" mode, including a full Windows boot and ending with launching of an application. For testing purposes, we chose the NotePad application. There are two types of these: from the Finder and from within the virtualization software. The reason for this is that both products have revised how they launch to meet Apple’s standards.
Launch the virtual machine from a suspended state, and resume from suspend (Adam).
Launch the virtual machine from a suspended state, and resume from suspend (Successive).
For the first test, we started at the Finder and launched the virtualization applications, which were set up to immediately launch the virtual machine. The visual feedback is fairly different between Parallels Desktop and VMware Fusion when Windows first starts up. Windows actually continues “starting up” for quite some time after you see the desktop. In some cases, it can take quite some time for Windows to complete its boot process. Most users don’t care if things continue so long as they aren’t held up.
As a result, we focused on timing to the point of actually accomplishing something. In this case, we configured NotePad to automatically launch. The test ended when the window started to render. This gave us a real world scenario of being able to actually do something as opposed to Windows just looking like it was booted.
The primary difference between the two types of VM launch test is that the computer is fully rebooted (both the virtual machine as well as Mac OS X) in between the "Adam" tests. The successive tests are launching the virtual machines and restoring them without restarting the Mac in between.
Successive tests benefit from both Mac OS X and possibly virtual machine caching and are significantly faster. However, you may only see these types of situations if you are constantly switching in and out of your virtual machine.
As with all of our tests, we performed these tests multiple times to handle the variability that can occur. Of those results, we took the best results for each product.
Clearly, virtual machines with more vm memory take longer to restore, so “more” is not necessarily better here. Use the smallest amount that does what you need to do well. In our case, we focused on 1 GB virtual machines in Windows 7 and 8 for these tests.
This year, we saw substantive difference in compression that is one of the best ways to compare CPU processing capabilities in different environments.
Most benchmarking suites measure CPU performance using file compression as at least one part of their analysis. We did the same. As a matter of interest, we used compression instead of decompression, because with today’s fast computers, decompression is actually much closer to a file copy than it is to CPU work. Compression requires the system to perform analysis to do the compression, and is therefore a better measurement of CPU.
Here, we tested two of the most common applications used in virtualized desktop environments: Microsoft Office 2010’s Word and Outlook. Users often go in and out of Word and Outlook, so we focused on successive launches. Similar to the OS launch tests, a successive launch test is done repeatedly without restarting Windows.
Most applications, including these, launch very quickly, with Parallels having a slight edge. Even so, launches are so fast on both virtualization products that even the worst case was very usable.
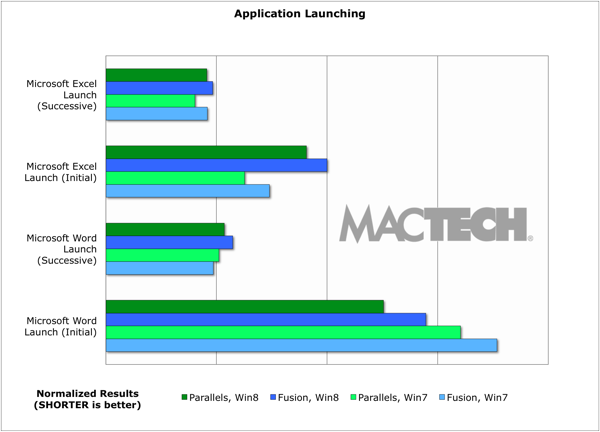
In all cases, launch times were quite fast from a user experience. It’s nice to see that all the Microsoft Office applications launch (typically) in a few seconds under both Parallels Desktop and VMware Fusion. Often, it felt nearly instantaneous to a user on the successive launches.
Application Performance Tests
In many cases, applications today perform so well and so fast, even under virtualized environments, that anyone would be pleased for small documents and activities. We focused our efforts on one of the more demanding and used applications: Internet Explorer 9.
Microsoft has a series of public benchmarks for seeing how well a browser performs. See http://ie.microsoft.com/testdrive/Views/SiteMap/ for all kinds of demos and performance tests. We chose a set of tests that took enough resources to measure well and had a consistent method of measurement.
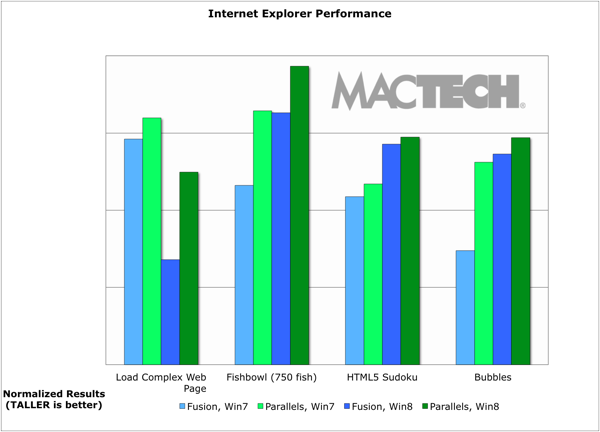
Across the board, Internet Explorer 9 performed better on Parallels Desktop than it did on VMware Fusion. Only the Sudoku test was close. All the rest were a clear win for Parallels.
Because the web is becoming more and more an application platform, we chose to focus on more advanced Web 2.0 technologies rather than simple html.
One of the most interesting things in the virtualization market is how little overhead virtualization takes today compared to what it used to. To assess this, we measured in a variety of ways. Specifically, we focused on CPU usage (overall for the Mac), which has an impact not only on usability but also, on laptops, how long the battery would last (although, there’s more to battery usage than CPU usage such as graphics processing and disk access). CPU usage was measured using "top" (a command line tool that’s part of UNIX with a minimum of 100 continuous samples averaged for the result). For all tests, we removed the high and low use outliers to give a more typical impact.
While Parallels did use substantially less CPU when you look at percentages, in reality, they both took so little of the CPU (0.7% – 3.8% depending on Mac model), that you can really let these apps sit idly and not worry about it bogging down your machine. CPU does, however, come into play for battery (see below).
Battery Tests
With Apple making it impossible to swap your batteries in the latest laptops, battery life is more important than ever. VMware Fusion relies primarily on the Mac OS and Windows settings to manage battery life. Parallels, however, added some special features (since Parallels Desktop 7) to help you stretch battery life.
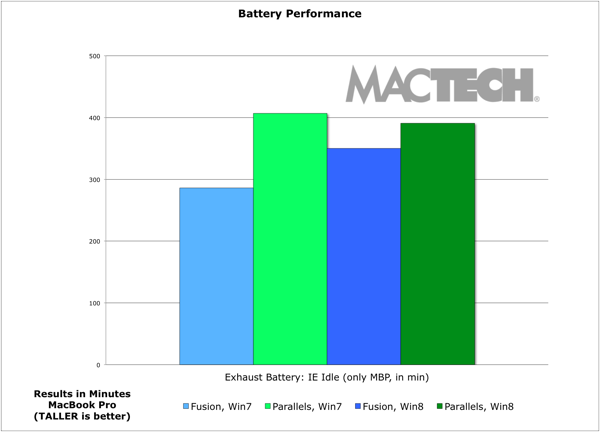
The result is noticeable. In our tests, Parallels got 40% more battery life on a virtual machine sitting idle than VMware Fusion on Windows 7. This was a couple of hours more of battery life on the MacBook Pro. If you are using your virtual machine for typing in Word, or using Excel, this is a reasonable approximation. That said, if you are “pegging” the CPU on your machine, or using an optical drive or hard drive, the difference will be less. For most travelers, the light CPU impact of Word/Excel or Internet Explorer use is probably what they are using a virtual machine for.
One of the common problems with File and Network IO Tests is caching. In fact, it’s common for benchmarkers to think they are avoiding caching when in fact, they aren’t. In the case of File and Network IO tests, there are two types of caching: in the host OS and in the guest OS. Furthermore, sometimes with groups of small files, we’ve seen performance changes that were unexplained (almost looked like caching but clearly can’t be) even after restarts of both the host and guest OS.
Worse yet, SSD’s and virtualization products tend to do sophisticated things with data containing blocks of zeroes such as data compression. Since all the major modern formats have data without zero blocks, it’s best to test using files that are real world (e.g., no zero blocks). For example, files that never have blocks of zeroes include: MP3, all the main graphics formats, zip/rar, html, dmg, pdf, etc.
In our tests, we used a set of four different 1 GB files with random non-zero data to give the most representative results and avoided caching. More specifically:
Sets of one or four 1 GB files with randomized data. To generate the file of exactly 1 GB, we used the dd command:
sudo dd if=/dev/urandom of=file1G-1 bs=$[1024*1024] count=1024
The idea behind these sets of four 1 GB files is to move enough data that we can see both real throughput and avoid caching at all levels.
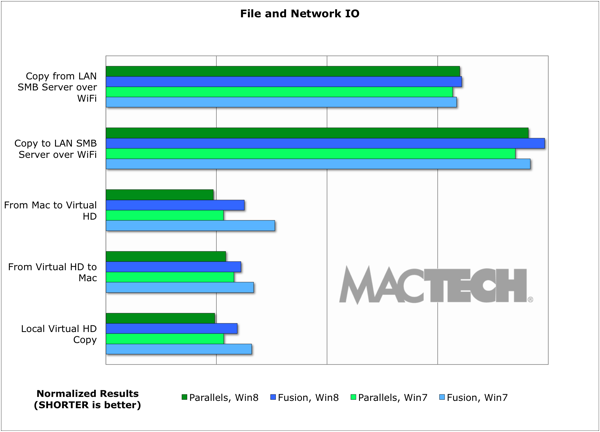
In most cases, Parallels was a bit to somewhat faster than Fusion. The biggest exceptions to this were file copies over Wi-Fi to and from the SMB sever, where they both performed similarly, and with local file copy in OS X as a guest where Fusion was faster.
We’re always on the lookout for new ways to measure graphics in particular. This time, again, we did look at some of the results of other benchmark suites, and found that their assessment of graphics were very clearly wrong (we could clearly see visually they weren’t right).
As a result, we again used 3DMark06 by FutureMark. 3DMark06 is a globally recognized and comparable measurement of 3D performance. Gamers use 3DMark to test their machines and tweak them for performance. We specifically did not use new versions of 3DMark, such as 3DMark Vantage and 3DMark 11, because they require DirectX 10 and DirectX 11 support, respectively (VMware Fusion supports through DX9, and Parallels Desktop supports through DX10). See http://www.futuremark.com/ for more information about 3DMark06.
Clearly, if you are going to play games and be serious about it, then running in Boot Camp is your best choice running Windows natively. Or if you are really serious, you might configure a PC with high-end video card not available for the Mac. However, Parallels Desktop is fairly close to playing games on a standard PC running Windows natively. Also, with a virtualization solution you don’t have to reboot, deal with driver issues, and more. We were pleased to see that VMware Fusion 5.0.2 has made major improvements to rendering over prior versions, but we did still see artifacts in one of the games.
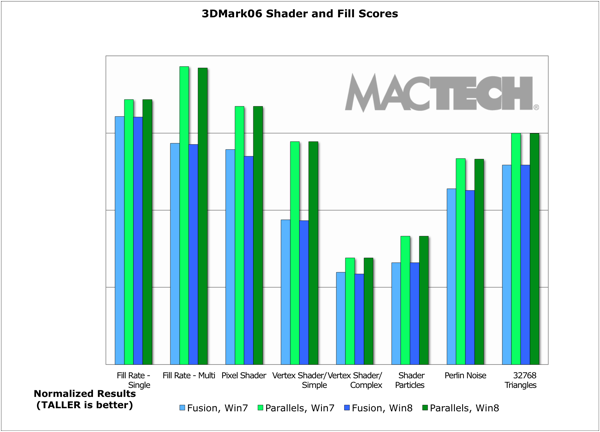
Without a doubt, Parallels Desktop’s greatest advantage over VMware Fusion is in 3D graphics. Not only is the speed difference there (Parallels Desktop is often significantly faster than VMware Fusion in graphics), but also everything just seems to run more smoothly.
Based on past experiences, we expected things to run well on the Mac Pro and MacBook Pro. We were very pleased to see how well all the Mac models run graphics and games—a noticeable difference from just a few years ago.
Obviously, the results for 3DMark06 vary greatly by the hardware they are on because of the graphics capabilities of each machine. As such, the best way to look at these is in the detailed spreadsheet where you can see results for each model for each OS. However, see below for information on what models run virtualization best overall.
Overall, these result charts will give you an idea of some of the things that VMware Fusion did well in. The overwhelming winner in this graphics competition is Parallels Desktop.
MacTech readers ask us about games performance. If you are looking for a casual gaming experience and don’t want to reboot, gaming under virtualization runs pretty well.
The 3DMark06 tests give a good indication of what the graphics and gaming performance will be like if a game is supported. Remember, some technologies may be required that may or may not be available in virtualization or, on one or the other of virtualization products. For example, Parallels Desktop 8 has “experimental” DirectX 10 support, where VMware Fusion 5 has support through DirectX 9.0EX. In addition, how well the games run depends on what Mac hardware you are running on as well (e.g., graphics card, speed of processor and RAM available). [Ed. Note: Parallels tells us “Parallels has dropped the term ‘experimental’ for DirectX10 due to recent improvements and good results seen by users. This does not imply, however, that every DX10 game, especially future games, will run flawlessly.”]
VMware tells us that games such as League of Legends, PlanetSide 2, Tribes Ascend, Walking Dead, Torchlight I and II, Fifa 2013, Darksiders 2, Warhammer 40,000: Space Marine, and Skyrim have worked well for folks. Indie games like Castle Crashers, Dungeon Defenders, and Sideway were also listed. Additionally, some non-first-person-shooter games such as Tropico 4, Rayman Origins, Magic the Gathering Online, Microsoft Flight, any of the Telltale games (Sam and Max, Puzzle Agent, etc) reportedly run well. This is not a comprehensive list. You can check in their forums on other games, or simply experiment for yourself.
Parallels has a list posted at http://forum.parallels.com/showthread.php?p=656018 with a number of DirectX 9 games including: Anno 2070, Bioshock 2, and Civilization V. DirectX 10 games include: Formula 1 2012, Battlefield 3, Sleeping Dogs, Snipper Elite V2, Need For Speed: The Run, Call of Duty: Black Ops II, F1 Race Stars, Assassin Creed III and Hitman: Absolution. Again, this is not a comprehensive list. The link above also has a number of unconfirmed user reports about games that work well, as well as those that have issues. As we said earlier, you can check in their forums on other games, or simply experiment for yourself.
Obviously, the DX10 games won’t run in VMware Fusion since it only has DX9 support. Similarly, games that require DX11 wouldn’t work in Parallels since it supports through DX10 only, but on a quick search, there are very few DX11 only games. That could change, obviously, in the future.
Even with the very useful 3DMark tests, we wanted to put real gaming to a real test. (Ok, so we were just looking for an excuse to play games and call it a "test", but we won’t tell anyone … right?). With the events in December, we had no interest in testing a “first person shooter” game, but with so many great games out there, this wasn’t a challenge to overcome. In choosing games to benchmark, we couldn’t pick a DirectX 10 game, since VMware Fusion doesn’t support DX10. So, we picked one non-first-person-shooter from the VMware list and one game from Parallels’ DX9 list.
Torchlight II just came out in the last several months, so we chose that for benchmarking and you can see a couple of tests that we run on each piece of hardware in both virtualization products. It played well in both places, and the higher the FPS (which we measured using FRAPS) just makes a huge difference in visible smoothness and a better game playing experience. Clearly, if you are going to play games a lot, put the right hardware behind it (e.g., the MacBook Pro Retina is an awesome experience, and if you have an option like on the iMac or Mac Pro, go for better graphics cards).
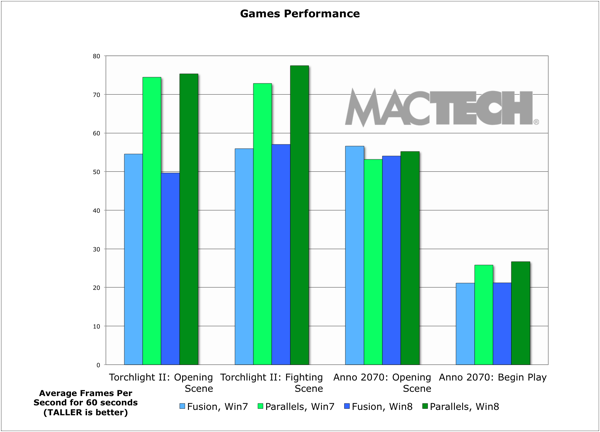
Torchlight II played quite well in both VMware Fusion and Parallels Desktop. It was playable even on the lesser machines, and was a pleasure.
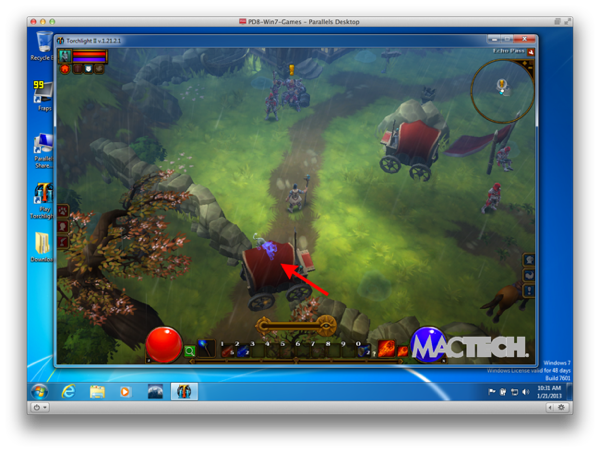
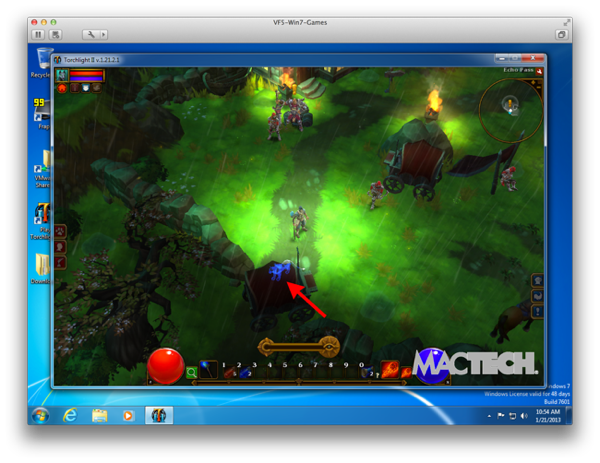
Sometimes one sees interesting things in these games that have more to do with the game than the virtualization. At one point in Torchlight’s opening scene, we saw objects become outlines. The clearest example is that you can see the wireframe of the panther as it walks behind the wagon (see arrow in screen shot). This is not about virtualization, but instead is done on purpose by the game so that you can see what’s behind objects that interfere with line of sight. In other words, both products rendered it correctly. In the end, we enjoyed a very playable Torchlight II experience under virtualization.
It was interesting to see in Anno’s opening scene that Parallels never exceeded 60 FPS, and given that consistency, this may be by design. [Ed. Note: Parallels states that “this is by design and explains that whenever an application in a guest OS requests to turn on vsync (vertical synchronization), Parallels Desktop does so (as hardware PCs also do) and uses vsync mode which limits frames per second to whatever the frequency of the attached monitor is — typically 60 FPS. This makes the resulting animation smoother.”]
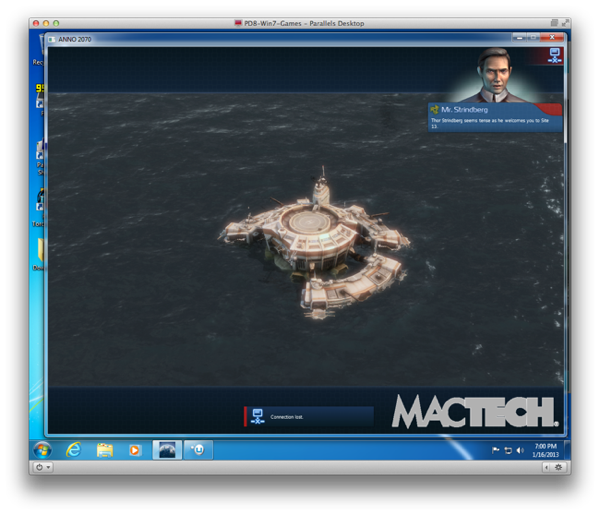
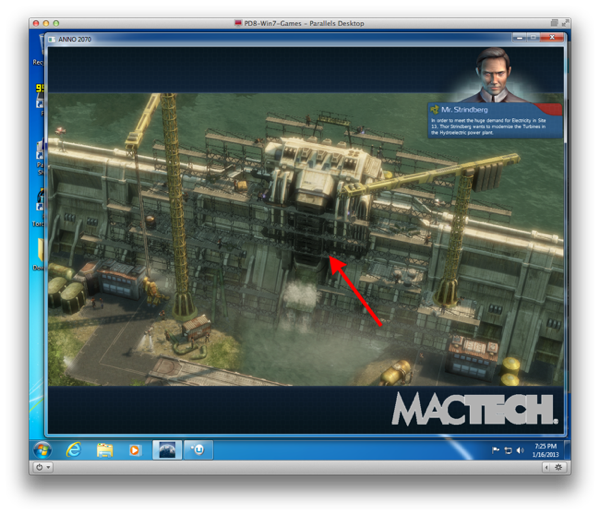
Once we began play in Anno, Parallels handled shading and lighting considerably better than VMware Fusion. Furthermore, Fusion had a variety of stray lines and artifacts. See the screen shots and compare to the Parallels equivalent.
Parallels Desktop would not play Anno on a MacBook Air with DX10 support turned on (likely due to the integrated graphics on this machine), so we had to set it to DX9 support for that one model of Mac.
Note shading and lighting appear flawless, with no visible artifacts
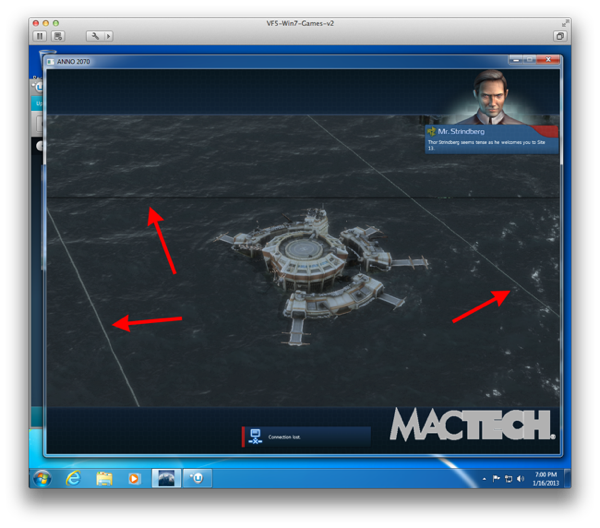
Note artifacts and inferior lighting/shading compared to Parallels
Note Shading and Lighting appear flawless with no visible artifacts
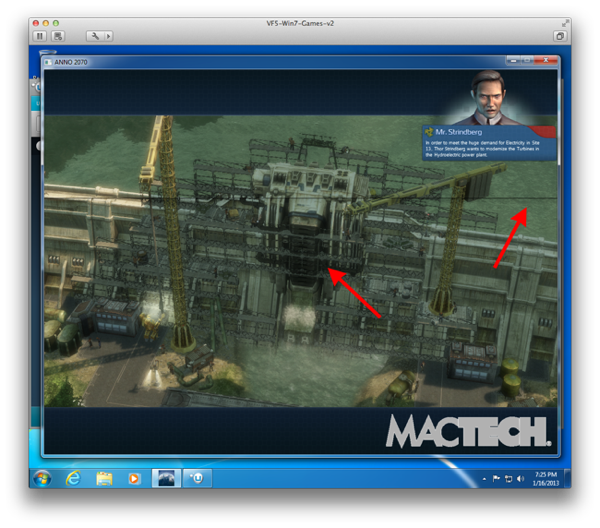
Note artifacts and dark shading/lighting
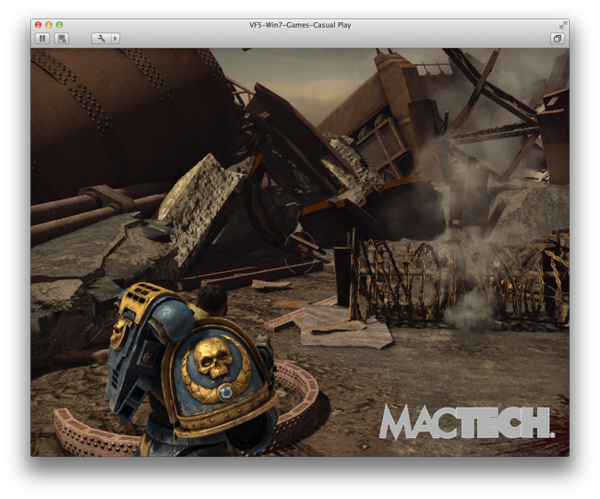
There are some games that are very fast action, and while we didn’t benchmark them, we wanted to get a look at how the graphics rendered and the feel of the game. Warhammer 40,000: Space Marine is a third-person action game that runs on both VMware Fusion and Parallels Desktop.

Warhammer played quite well in both environments on the MacBook Pro Retina. Parallels took longer to start the game, but once in it performed well and rendered graphics and action well. VMware rendered well most of the time, but there were a few occassions where we’d see “noise” or drop out pixels in certain objects. It didn’t happen often, and we couldn’t screen shot it. And while it didn’t impact play of the game, we did notice it when it occasionaly appeared.
All of the above games were specifically chosen because they only required DX9 support. Now, Parallels touts their game playing ability, and even goes as far to list a number of DX10 games that work. We didn’t want to just take their word for it.
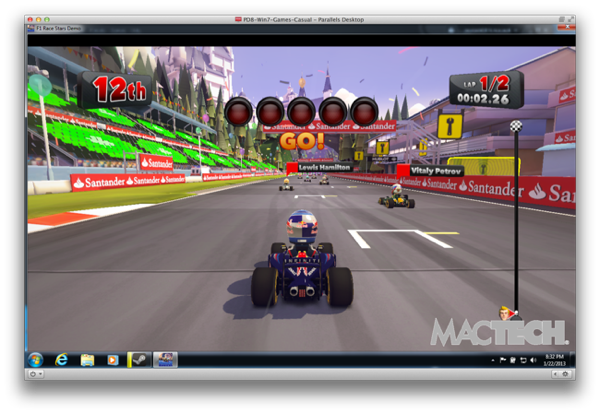
Just for kicks, we forced ourselves to play one of the DX10 games. I know, I know – it’s a tough job, but someone’s got to do it. F1 Race Stars only supports Direct X 10 and 11, so it wouldn’t play on VMware Fusion at all, but it did play on Parallels Desktop 8. While it’s very hard to get a screen shot while playing the game (and I keep telling myself that’s why the screen shot shows 12th place), the game was very playable and a completely solid experience (we played it on the MacBook Pro Retina and gave the game vm 2 GB of RAM). All the graphics were as they should be (no artifacts), and the game was smooth. Definitely a ton of fun to play.
The problems with remnants and such we saw in other places as well in VMware Fusion. For example, in the screen shot shown, VMware Fusion running Internet Explorer in Windows 8 had issues with stray boxes and lines.
even while running Internet Explorer
If graphics are important to you in virtualization, you may want to consider which model of Mac you use. As you can see from the chart, the MacBook Pro Retina, and the Mac Pro remain the best. However, all of the models work. The only one that struggled was the MacBook Air presumably due to its lightweight graphics hardware.
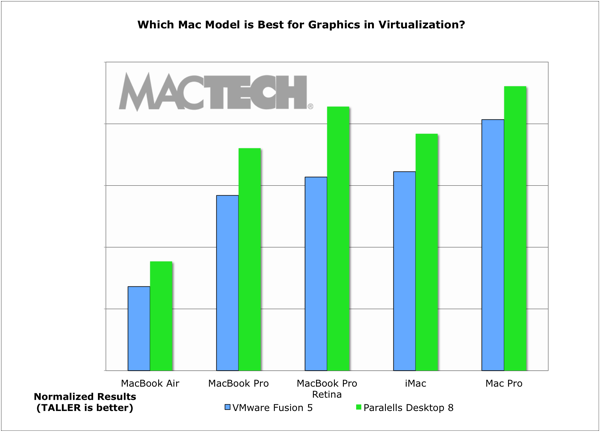
Reminder, the iMac we tested with was the “Late 2011” model, which since it’s what was available when we began testing. The newer iMac has additional options for graphics cards and if you take advantage of the higher end graphics cards, we would expect to see iMac graphics rival the Mac Pro and exceed the MacBook Pro Retina.
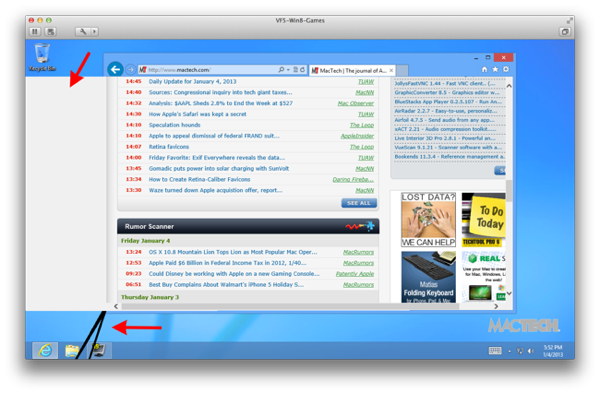
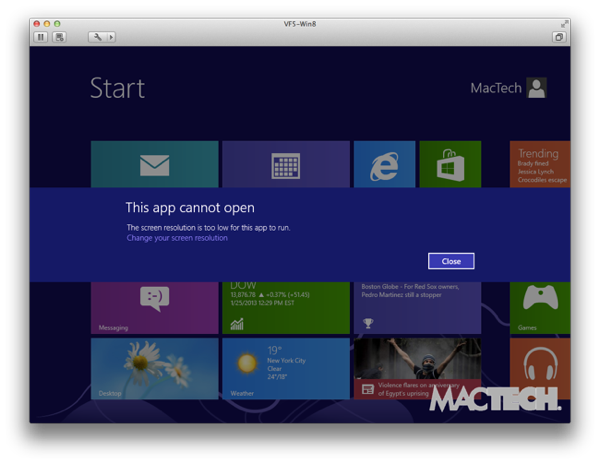
Windows 8 has requirements for screen size that can be an issue for the smaller screen Macs such as the MacBook Air 11″. We noticed this when launching Internet Explorer on Windows 8 in a smaller virtual machine window. VMware Fusion cannot launch the version of IE shown on the Windows 8 Start Screen, but it can launch Internet Explorer 10 from the Windows 8 desktop (it’s a different version of IE). Parallels, on the other hand, is able to launch both versions of Internet Explorer.

We’re not sure what Parallels is doing here, but clearly they’ve come up with some workaround to support Windows 8 running on smaller screens.
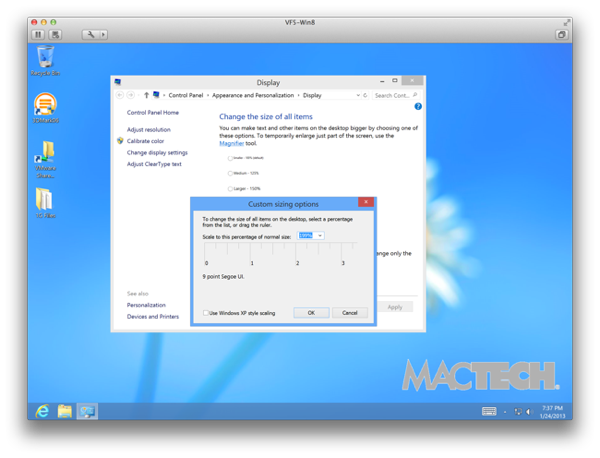
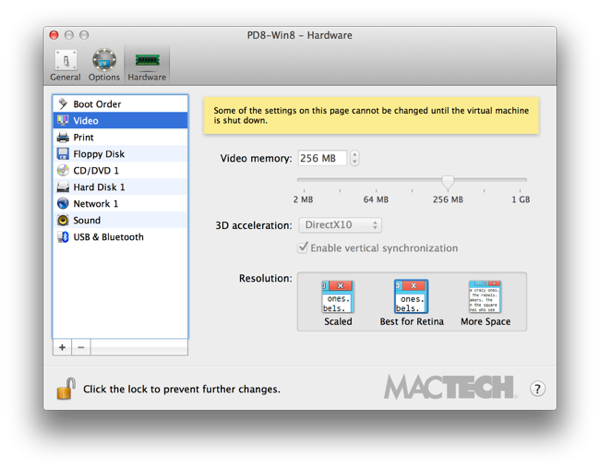
Both VMware Fusion and Parallels Desktop tout support for Apple’s Retina displays. In reality, however, they do it quite differently. In VMware Fusion, you check a box to enable Retina support. When you do that, the resulting window is tiny (about one quarter the size). What we didn’t realize until VMware explained it to us is that at that point, you need to manually change the size of “text and other items” in Windows (7 or 8). To do this, within Appearance and Display, you select the “custom sizing options” and choose the scale (about 200%, but since Windows has a bug at 200%, it’s best to use 199%).
In Parallels, you simply choose whether you want scaled (for those items that aren’t using scalable elements), Best for Retina (scaling items and giving you higher resolution) and More Space (which gives you the maximum screen real estate). This is similar to how Apple gives you choices for the Retina display in OS X’s Display preference pane. Parallels takes the approach of automatically changing the sizing of items, as well as making other adjustments to the interface so that they are reasonable sizes automatically.
The Windows interface is far far nicer in Retina, just like it is on a Mac. Some of the most incredible differences are in the text, and in hi-res icons such as a folder. Take a look at what both VMware Fusion and Parallels Desktop are able to do on the Windows 7 and Windows 8 desktops when compared to non-Retina.
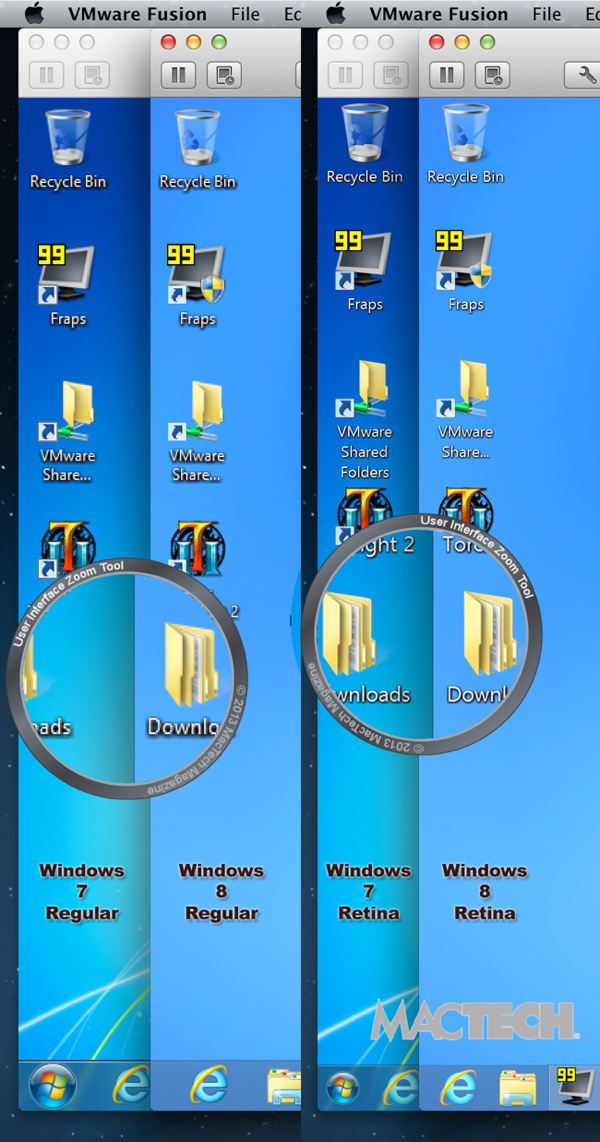
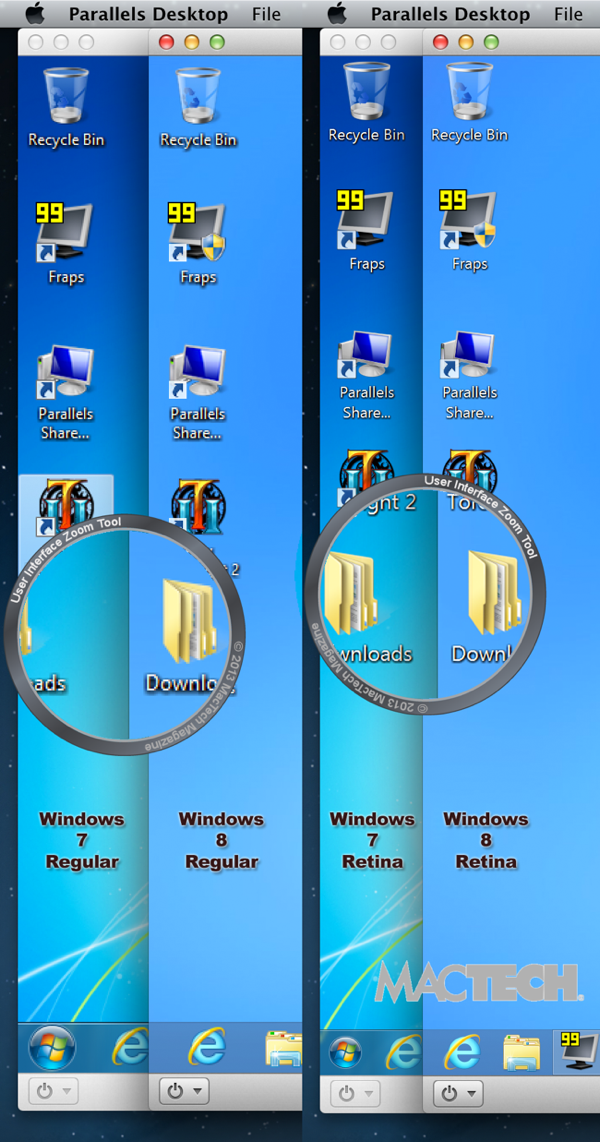
For a lot of interface elements, both VMware and Parallels do a great job. In fact, Apple’s Boot Camp does a great job in Windows 7 (Apple currently doesn’t support Windows 8 in Boot Camp). See the examples for Boot Camp, VMware Fusion, and Parallels Desktop. Take note of the icon quality of the Recycle Bin, and folders as well as the clarity of the text, Start Menu Button, and application windows. You can also get a bit of a feeling of what non-Retina would look like when you look at the icon for 3DMark06 which is not higher resolution, but scaled.
Often, items are not the best size in VMware Fusion. For example, here’s the Start Screen in Windows 8. The icons are too small, and the interface items are not optimally distributed as they should be for the Metro interface.
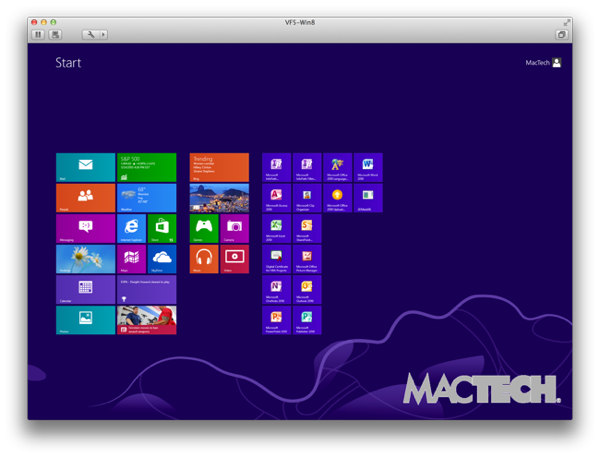
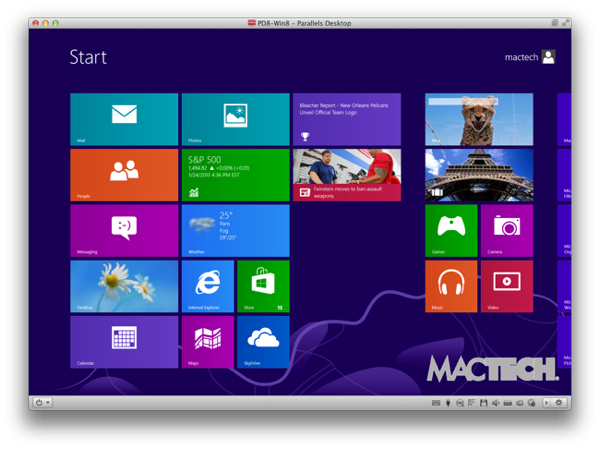
At time of this writing, Apple’s Boot Camp does not support Windows 8. Furthermore, PCs don’t have Retina displays. In both Parallels and VMware Fusion, however, the Start Screen is vastly improved over what a PC can display.
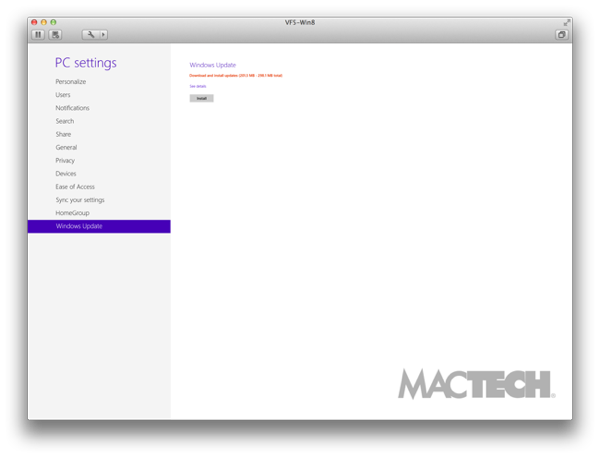
The automatic resizing that Parallels does is more than just maximum use of the Metro interface or Start Screen. For example, take a look at the Windows Update screen.
Text and Elements Too Small, Harder to Use
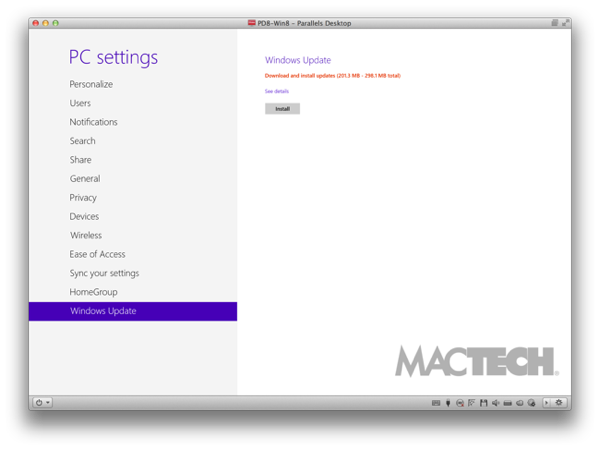
Proper Proportions and More Easily Usable
We were most interested in how the products performed in enhancing the user experience in Windows. Personally, I like the Windowed environment for virtualization, but so many people use both VMware and Parallels in their Unity and Coherence views, respectively. If you are using a Retina machine, then only Parallels’ methodology is usable.
Both products have incredible clarity of text and objects when using Retina support. That said, there is a difference in how much more thorough and easy the support is. Without a doubt, Parallels not only makes the most of Retina support to outshine VMware Fusion, but it also outshines a typical native Windows experience. Trust me when I tell you that, in person, the difference between Retina on Windows and not is even more astounding than for OS X.
There are additional tidbits that we learned through the incredibly complex process of testing virtualization products. Here are some additional insights.
64-bit, Virtual Processors, and RAM
We chose 64-bit because it has become the standard on Windows to give users the additional memory they would like. In our experimentations, however, we found the 64-bit default Windows 7 installation was about 2.5 GB larger than the 32-bit in hard disk space. Not a huge deal, but something to note.
These days, the decision is fairly simple. If you have an application that can make use of multiple virtual processors, and this includes 3D Graphics, and your Mac has enough horsepower, then you should use them. Otherwise, it’s not necessary.
Then again, if speed is that important to you, you should ask yourself whether to run the app natively on your Mac instead of in a virtual machine. Sometimes, though, like with some industry-specific software, you may not have an option.
When it comes to RAM, less is often better. You see, the virtualization products need to do a lot with RAM, so only increase it if you really need it and make sure you have enough actual RAM in your hardware. As a general rule, 1GB virtual machines are the way to go for best boot, suspend and resume times. If you are running virtualization, try to have 8GB or more actual RAM in your machine.
Windows 7 or Windows 8?
You may be trying to decide between using Windows 7 and Windows 8. In short, both run well. Let your decision be guided not be speed or performance, but instead by whether you want or need to run one version or the other. Certainly, Windows 7 is likely to be better “vetted” at this point, but we had very few issues with Windows 8 in either virtualization solution.
The Best Macs to Run Virtualization
All the current Macs perform quite well running virtualization, but if you are going to do it a lot, you may want to optimize your hardware. The MacBook Pro Retina was an amazingly good experience. With its high-speed processor, SSD, and lots of RAM coupled with the right level of graphics card, it was a superb experience. Even the MacBook Air did quite well.
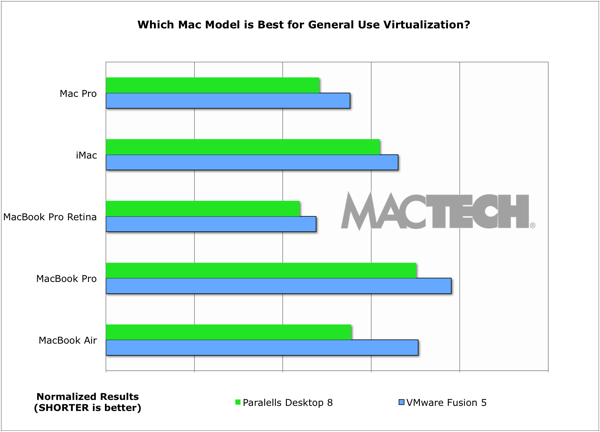
The main things to consider are as follows. Try to use an SSD rather than a rotational (mechanical) hard drive. Even the new Apple Fusion drive will likely help (but we didn’t test as they weren’t available at the time we purchased hardware). Get plenty of RAM for your hardware: optimally 8GB or more. If graphics are important, try to go beyond the lightweight graphics hardware in the MacBook Air.
Again, note that the iMac we tested with was the “Late 2011” model, which since it’s what was available when we began testing. The newer iMac has additional options for Apple’s Fusion Drive, as well as higher end graphics cards, which would likely bring the iMac closer to the Mac Pro and MacBook Pro Retina.
Starting about a year ago, Apple has finally changed their license with OS X (but only for Lion and Mountain Lion) so that users can run a virtual machine with Lion and Mountain Lion as the client OS. As a result, both Parallels Desktop and VMware Fusion tout that they can run OS X in a virtual machine. Of course, it was a moral imperative for us to check this out and see how it runs.
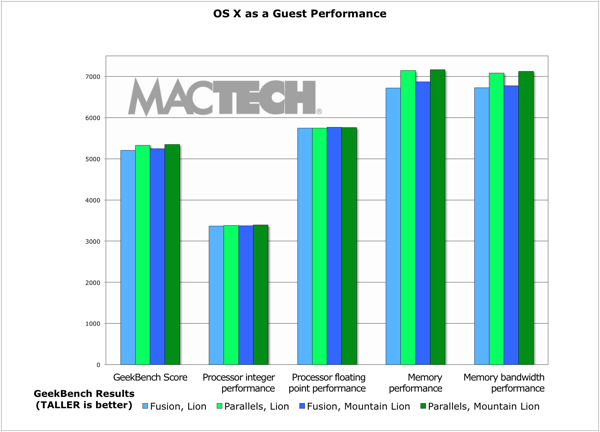
In short, they run pretty well. Parallels booted OS X a bit faster, and VMware Fusion shut down considerably faster. But we also wanted to see about virtual machine speed. Without doing comprehensive benchmarks, we did a quick run of GeekBench. In short, they ran comparably to each other. Clearly, neither company has fully optimized yet for OS X and I expect we’ll see improvements on this front.
What would you use this for? One of the greatest uses may be for developers testing different builds of OS X and their product, and wanting to do so in a protected way. In short, testing, hacking, networking (if you need a second machine), sandboxing (for security). Beyond that, well, it’s a bit of a strange experience to say the least.
One thing to note for both products: There is no easy or express installation for OS X as a guest. You need to install them manually, and as such, neither product install their tools. While, if you look, you can tell if the tools are installed or not, it’s not going to be obvious for most users. Once you start to resize your window beyond 1024×768, use cut/copy/paste, or drag and drop features, you’ll realize that things don’t work right and start to search for a problem (which is that the VMware or Parallels tools are not installed in that virtual machine). Bottom line: Don’t forget to install the tools (for either VMware or Parallels) in your OS X guests. Hopefully, this experience (either with a reminder or better installation procedure) will be improved in both products for future releases.
Both VMware Fusion and Parallels Desktop for Mac are excellent products, and both allow you to run many OSes quite well (including OS X now). In the end, when you decide which product to use, you should take into account what’s most important to you.
Windows 7 and 8 are such a pleasurable experience that unless there’s some driving reason otherwise, you should use either of those rather than XP under either virtualization product.
When it comes to whether you should use multiple processors or 64-bit virtual machines, it depends on your use. If you have a real need for either, and can articulate a reason for it, then use them. They do work well. With that said, if you don’t have a specific need, then don’t bother with multiple virtual CPUs. As for 64-bit, you should use it (especially in Windows 7 and 8) unless you have a driving reason not to.
Many people have the feeling of "more is better," but when it comes to RAM in the virtual machine, that is not necessarily the case. More RAM means longer virtual machine launch times, suspends and resumes. For most users, 1 GB of virtual machine RAM will work best for Windows 7 and 8. Use more than that only if you really know you need it. Gaming may do best with 1.5-2 GB of RAM if you can spare it.
In the vast majority of our overall tests, Parallels Desktop 8 won. Again, if you count up the general tests (including the top 3D graphics scores), Parallels won 56% of the tests by 10% or more. If you include all the tests where Parallels was at least 5% faster, as well as the balance of the 3DMark06 graphics tests, Parallels increased the lead further.
If you focus exclusively on 3D graphics, as measured by 3DMark06, Parallels won by an even larger margin. Specifically, Parallels won 62.6% of the tests by 10% or more, and was also a bit faster on an additional 8.9% more of the tests, and tied on the rest. In other words, Parallels Desktop 8 was noticeably faster than VMware Fusion 5.0.2 in 3D graphics.
If you are a traveler, Parallels Desktop has power management features that stretch your battery life. On the MacBook Pro, we saw about 40% more battery time on an idling virtual machine (a couple of hours of additional use in Windows 7) than we did on VMware Fusion in the same test.
To be clear, this article is not a product review; it’s a benchmarking analysis. You should use it as part of your decision combined with other factors, such as product features, user interface, which OS you want to run, graphics capabilities and support to make your product choice.
One thing is clear: virtualization for the Mac works well. Really well. Even with virtualization running as well as it does, I expect that we’ll see virtualization products keep getting better and better.
About the author(s)…
Neil is the Editor-in-Chief and Publisher of MacTech Magazine. Neil has been in the Mac industry since 1985, has developed software, written documentation, and been heading up the magazine since 1992. When Neil does a benchmark article, he likes to test the features that people will use in real-life scenario and then write about that experience from the user point of view. Drop him a line at publisher@www.mactech.com.
Introduction to Benchmarking Methodology
The purpose of this appendix is to outline the basic parameters for how MacTech Magazine performed benchmarking tests on VMware Fusion, and Parallels Desktop for the purpose of evaluating the performance of virtual machines running Windows 7 and 8, as well as OS X as a guest OS.
Consistency
Since the tests involve both multiple machines and multiple pieces of software, the focus was on creating as much consistency across the tests as possible. MacTech accomplished this in several ways.
First, each set of tests was performed by a single MacTech staff member to eliminate any of the natural inconsistencies that often occur across individuals.
All of the tests were performed on the same version of the Mac operating system across the different hardware. At the time of the tests, this was OS X 10.8.2 and included the most up-to-date versions of Apple patches as prescribed through "Software Update" in OS X.
All of the tests were done on "virgin" systems, i.e., freshly wiped hard disks, with fresh Mac OS X, virtualization application, Windows and Microsoft Office installations, with no third party software installed beyond the standard Mac OS X. Only one virtualization application was installed to avoid any possible interactions. Furthermore, care was taken to make sure the virtual hard drives were located in a similar position on the hard drive.
All of the tests were performed with the most up to date set of patches for Microsoft Windows and Office as prescribed by Microsoft’s automatic updates, including service packs, recommended updates.
Avoiding Interactions
While the tests covered a variety of applications, all tests (where appropriate) were performed with only that single application open. In other words, to the extent possible, no other applications will be running. (Obviously excluding background and OS tasks that are part of a standard install of either OS or Microsoft Office.)
To avoid issues with a noisy network, the test machines were installed on what was considered a "quiet" network with minimal traffic. MacTech monitored the use of the network to make sure that the machine does have network access, but is not impacted by the network.
Measurements, Testing and Outliers
For timed tests with results under 60 seconds, tests were measured to within 1/100th of a second. For those over 60 seconds, tests were measured to within a second.
Most tests were performed at least three times per test and per machine configuration, and often 5+ times depending on the test. Outliers indicating a testing anomaly were retested as appropriate.
In most cases, the tester used successive tests, not "Adam" or "first" tests to better emulate typical daily use.
Those tests that could be impacted by the size of the window were tested with the same window size, and screen resolution under all scenarios.
Some tests were eliminated because the machines simply performed too fast to get an accurate measurement. For example, sending or sorting emails always performed faster on the machine than the tester could measure.
Appendix B: Testing Results
In keeping the results fully open, MacTech is making the test data available in the form of an Excel spreadsheet. Simply drop us an email and we’ll be happy to provide it to you.