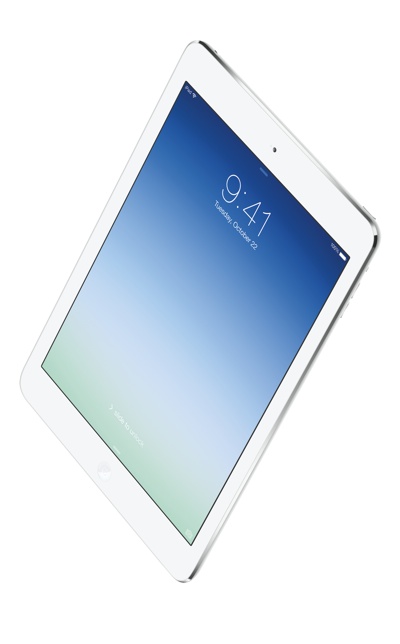
Apple and Samsung tie for the highest rank in overall satisfaction with a score of 826 each in the J.D. Power 2015 U.S. Tablet Satisfaction Study—Volume 1 (www.jdpower.com). Both brands perform particularly well in features and styling and design. Amazon (818) and Microsoft (815) follow closely in the rankings and each performs well in the performance factor.
The study, now in its fourth year, measures customer satisfaction with tablets across five factors (in order of importance): performance (28%); ease of operation (22%); features (22%); styling and design (17%); and cost (11%). Satisfaction is calculated on a 1,000-point scale.
The market for tablets has grown during the past several years as the number of tablets purchased at retail stores has increased since the study was launched in 2012. In the 2015 Volume 1 study, 58% of tablet owners indicate purchasing their tablet in a retail store, compared with 54% in 2012, while 41% purchase online and just 1% purchase over the phone.
Customers who purchased their tablet online rate their purchase experience higher than those who purchased in a store (8.4 vs. 8.2, respectively, on a 10-point scale). Price is the primary driver of purchase experience satisfaction with the online channel. The average reported price for a tablet purchased online is US$291, compared with $329 for a tablet purchased in a retail store. When it comes to price paid, tablet purchases made online generate a higher satisfaction rating than for those purchased in a retail store (8.1 vs. 8.0, respectively).
According to J.D. Power, overall customer satisfaction with tablet devices is 815, a decline of six points from 821 in the 2014 U.S. Tablet Satisfaction Study—Volume 1. Among tablet owners who are highly satisfied with their device (rating of 9 or 10), 61% say they “definitely will” recommend their tablet manufacturer, compared with just 9% of those with low satisfaction (ratings of 1 to 5).
Prior to purchasing a tablet, 19% of customers rely on lower price to help drive their brand purchase decision. Brand reputation (17%) and device features (14%) are also key drivers of brand purchase choice.
The 2015 U.S. Tablet Satisfaction Study—Volume 1 is based on experiences evaluated by 3,444 tablet owners who have owned their current device for less than one year. The study was fielded between September 2014 and February 2015.


